Dashboard options
There are several options that should be reviewed and adjusted depending upon an organization's requirements for the Blue Dashboard. These options can be modified at any time, but changing these options will have an impact on the user experience.
Data generation options
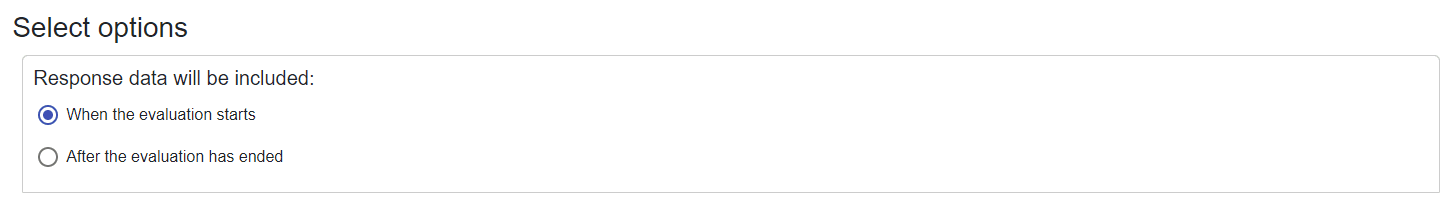
Response data will be included - Choose to make response data available as it is being collected, or hold back providing response data until the evaluation period has ended and all feedback has been received. Either way, this data will only be included by navigating to the Actions page and retrieving project information.
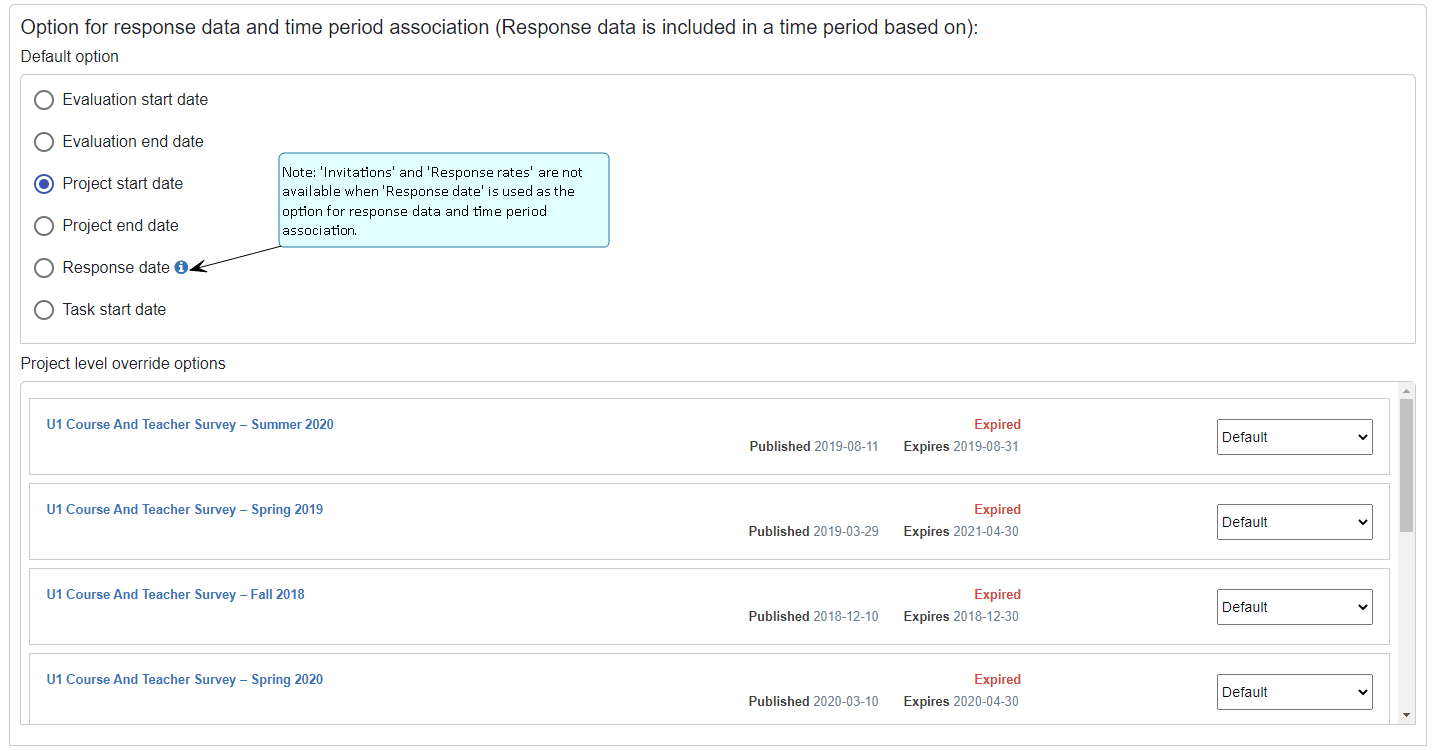
Response data is included in a time period based on - Choose one of the date options that the time period for the response data will be based on.
There are multiple options that determine how response data is included in a time period. The options are either based on evaluation start date or evaluation end date, project start date or project end date, or options that allows response data to be included in a time period based on either the response date (i.e. the response submission date) or the task start date, the last two options makes it possible to support subjects that receive responses across multiple time periods.
'Invitations' and 'Response rates' are not available when 'Response date' is used as the "Option for response data and time period association".
Paper responses are not available in the dashboard when task start date is selected, because paper based responses do not have tasks associated with them.
For example:
If the evaluation period for course MATH 101 starts June 15 and ends July 15, and it is part of a larger project that starts January 1 and ends December 31, MATH 101 should be included in which Time scale?
Time scales are defined by quarter in this example
| Name | Project start date | Project end date |
|---|---|---|
| Quarter 1 | January 1 | March 31 |
| Quarter 2 | April 01 | June 30 |
| Quarter 3 | July 01 | September 30 |
| Quarter 4 | October 01 | December 31 |
| MATH 101 | ||
|---|---|---|
| Response data is included in a time period based on | MATH 101 date | Time scale |
| Evaluation start date | June 15 | Quarter 2 |
| Evaluation end date | July 15 | Quarter 3 |
| Project start date | January 01 | Quarter 1 |
| Project end date | December 31 | Quarter 4 |
| Response date | November 15 | Quarter 4 |
| Task start date | June 15 | Quarter 2 |
Project level override options - Each project can be configured to use any of the five time period options above. For example, it is possible to have the projects that are used for historical data migration to use different time period options than the current active projects.
Statistics
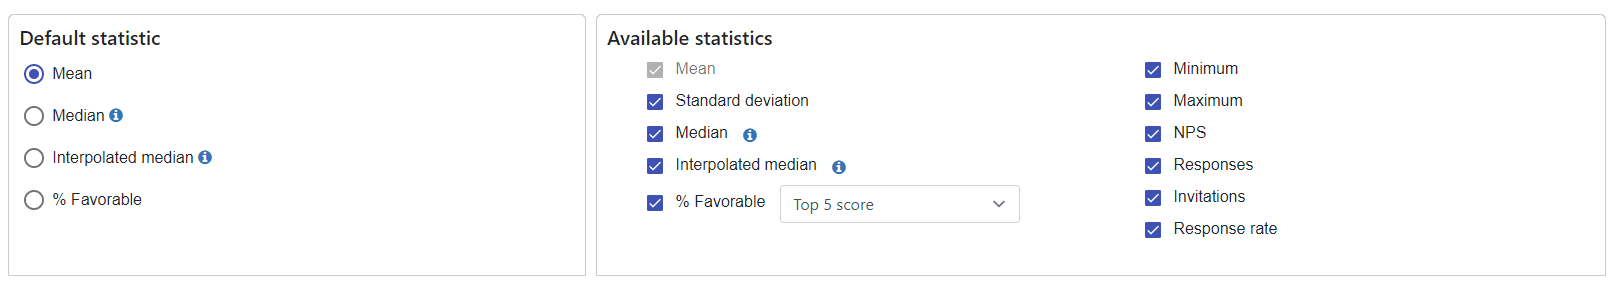
Default statistic - Select the statistic that the trend analysis chart will be based on. The user has the ability to change the default for their own dashboard, but the default statistic setting applies to all users initially. This setting will not affect the summary view widget.
Available options include:
- Mean
- Median
- Interpolated median
- % Favorable
Median and interpolated median are not statistically appropriate for a question group that contains multiple questions. In the case that median or interpolated median is selected as the default statistic, but is not appropriate for a question group, chart trend lines and subject summary details will be based on the mean.
Available Statistics - Select which statistics will be available for end users on their dashboard.
Available statistics include:
- Mean
- Standard deviation
- Median
- Interpolated median
- % Favorable
- Minimum
- Maximum
- NPS
- Responses (response count)
- Invitations (invitation count)
- Response rate
Blue Dashboard considers any Single Selection questions with an 11-point scale to be a potential NPS question. The NPS calculation treats the first option as 0, second option as 1, all the way to the final option as 10. The NPS statistic is only available on Blue Dashboard when there is at least one question that can be considered an NPS question.
The response count for a question group is defined as the response count of the question in the group that has received the most responses. Therefore Response count for a question group provides a relative idea of how many responses are being calculated. It is also possible that the respondents for each question may be different.
For a question group with multiple questions, the invitation count and the response rate statistics are based on the question that has been selected to represent the response count of the question group.
The term “% Favorable” refers to the percentage of respondents who give favorable responses to a particular question. For instance, if a survey asked respondents whether they agreed or disagreed with a particular statement, the percent favorable would be the percentage of respondents who answered “agree” or “strongly agree”. The % Favorable statistic has a default set to the top 2 scores, but the administrator can modify this to the top 1 score, top 3 scores , top 4 scores , or top 5 scores. This is a dashboard wide setting, which means the admin cannot modify this per question group.
Pre-calculated norm options
Determine how the dashboard calculates the pre-calculated norms for benchmarking
Norm calculation
- Norm across responses - calculates the average of all responses in a group such as department or college. The averages are calculated based on a field value. This value is any of the available course or instructor fields present in the dashboard. This returns the average of all responses for the courses with the same field value.
- Norm across subjects(applies to mean only) - compare an average of a particular subject against a "norm" of a group such as department or college. In Norm across subjects, the "norm" of a group is calculated as an average of subject averages (in other words, average of averages). For example, if you are creating a department-level norm, this norm is used to calculate the average of all course averages in that department.
Exclude respondent groups from norm - Choose to exclude one or more respondent groups from the norm calculation. This is particularly useful in 360 evaluations where the self group would often be excluded from the norm calculation.
Percentile calculation:
- Default (same as Excel)
- Nearest rank
- Linear interpolation between closest ranks
Percentile can be available for:
- the mean of the subjects
- the median of the subjects
- the interpolated median of the subjects
- the % favorable of the subjects
- the response rate of the subjects
Pre-calculated k-th percentile - this is where the administration will decide which percentiles need to be calculated during the data generation stage. Decile (90%, 80%...10%) is configured by default, but admins have the freedom to configure any other specific list of k-th percentiles, for example if we only need quartiles we can uncheck six of the available percentiles and only use three checkboxes as 75%, 50%, 25%.
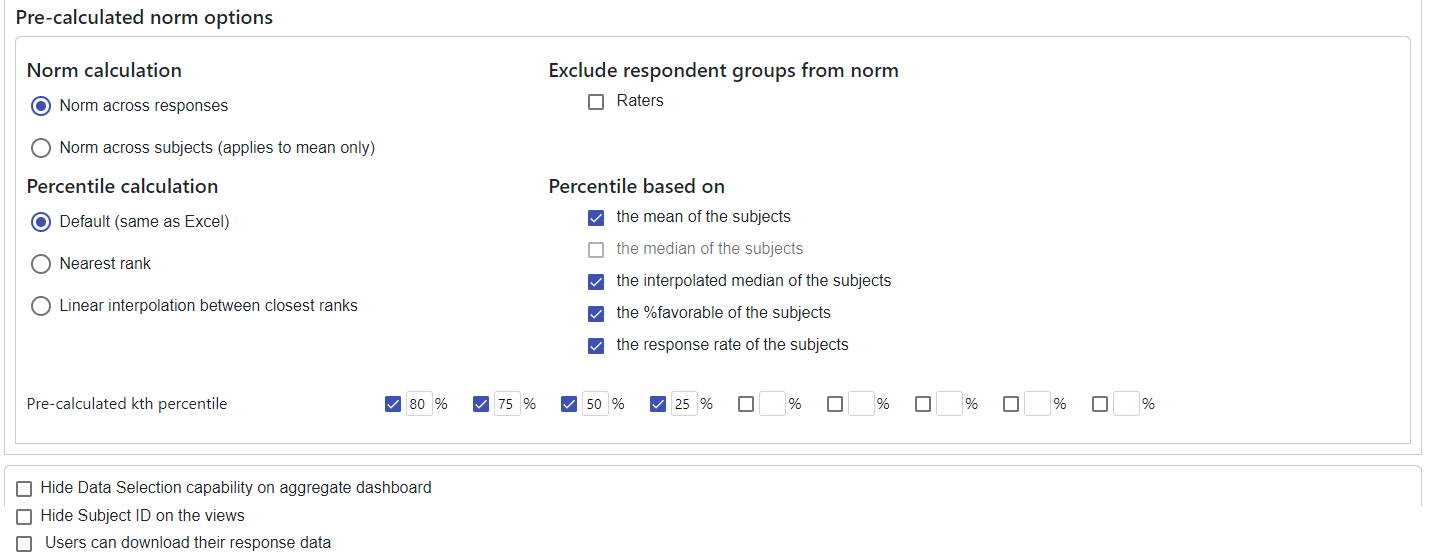
Hide Data Selection capability on aggregate dashboard - When enabled, the users will not be able to access the Data Selection page
Hide Subject ID on the views - When enabled, the Subject ID will be hidden from all dashboard views for both aggregate and individual dashboards.
Users can download their response data - When enabled the users will be able to download their raw response data for the information available in the Blue Dashboard.