Demographics
In Blue Dashboard there are several types of demographic fields that are used for filters, lists, etc.
- Primary subject demographics (i.e. Course demographics)
- Secondary subject demographics (i.e. Instructor demographics)
- Respondent demographics (i.e. Student demographics)
- Respondent groups (i.e. Students, Peers)
Be aware, the primary-secondary subject relationship demographics are available as part of the secondary subject demographics in the Blue dashboard. Also the primary subject-respondent relationship demographics are available as part of the respondent demographics in the Blue dashboard.
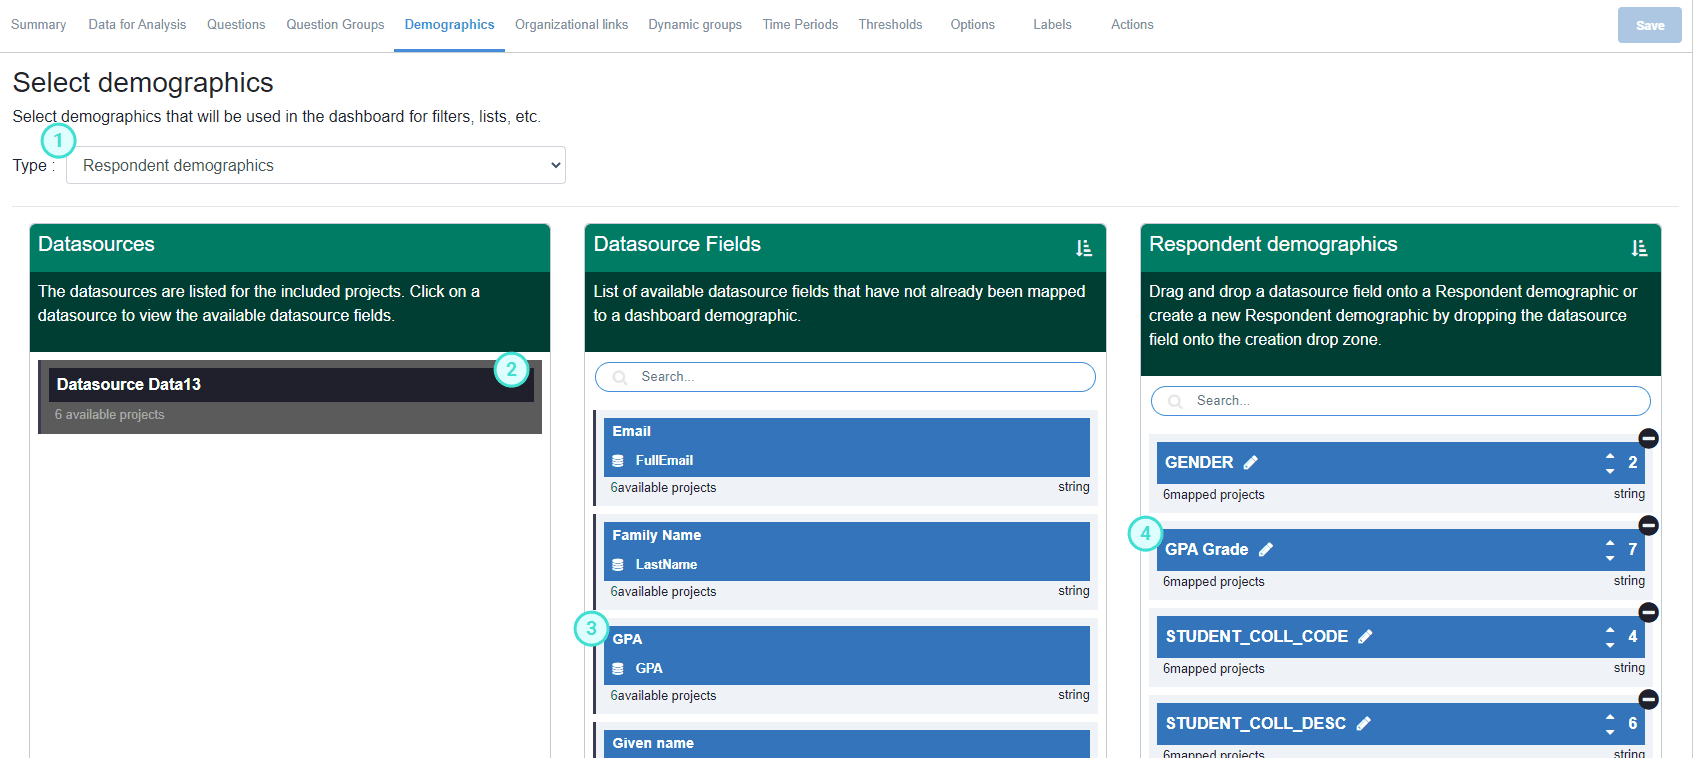
Select a type of demographics that will be used in the dashboard. Based on the projects selected, the dashboard will load the corresponding datasources.
1. Select a demographic type
Select one of the possible types of demographic to proceed.
2. Select a datasource or project
Select the datasource name or project to display a list of all of its items in the next column.
Click on # available projects to expand the list and show its linked items.
3. Select the datasource fields (or respondent groups)
In the second column, drag and drop an item (datasource field or respondent group) to the appropriate demographic, or create a new demographic by dragging the field to the creation drop zone.
- Only the available items that have not already been mapped to a dashboard demographic will be displayed.
- The demographic mapping will be applied to all projects with the same datasource.
- There are only 3 types of datasource fields available for the Blue Dashboard:
- String
- DateTime
- Integer
The system recognizes that similar entries within the same datasource can exist, therefore they can be mapped together. For example, a datasource could contain a legacy ID and a new ID for the same course.
Should the questions/projects mapped for the Blue Dashboard come from different datasources, the interface allows mapping similar fields from multiple datasources together. If these fields are identical to existing dashboard fields they will be automatically mapped.
In order to manually map these fields together, drag and drop the field to the appropriate demographic.
4. Organize the display order of fields in the filter menu
Use the up and down arrows to determine the order in which the fields will appear in the filter menu.
For demographics the display order of the fields also determines the order of priority:
- in calculating the respondent thresholds when multiple respondent demographics are being applied in the filter.
- in the display order on the filter and comparison pop-ups.
- in the display order of the additional subject information alongside the subject name and subject ID on the dashboard.
- Respondent groups are treated the same as respondent demographics meaning that they can be applied as filters and are optional (mapping them is not necessary if they aren't needed as filters).
- Respondent groups can be mapped across projects. If the respondent group names are identical across projects they will be automatically mapped, but in cases where the name is different they must be manually mapped.
- Some respondent groups are designed to have just one member, so in this case they can be excluded from the respondent threshold by enabling the Respondent threshold does not apply to this group option available when editing the respondent group.
- Mapped respondent groups can be merged together to create a virtual respondent group.
- By default, virtual respondent groups have the Respondent threshold does not apply to this group option enabled.
- The threshold exclusion applies when the filter only contains a specific respondent group or virtual group, or when the comparison only contains respondent/virtual groups.
- Remove a demographic field by clicking the minus symbol (-).
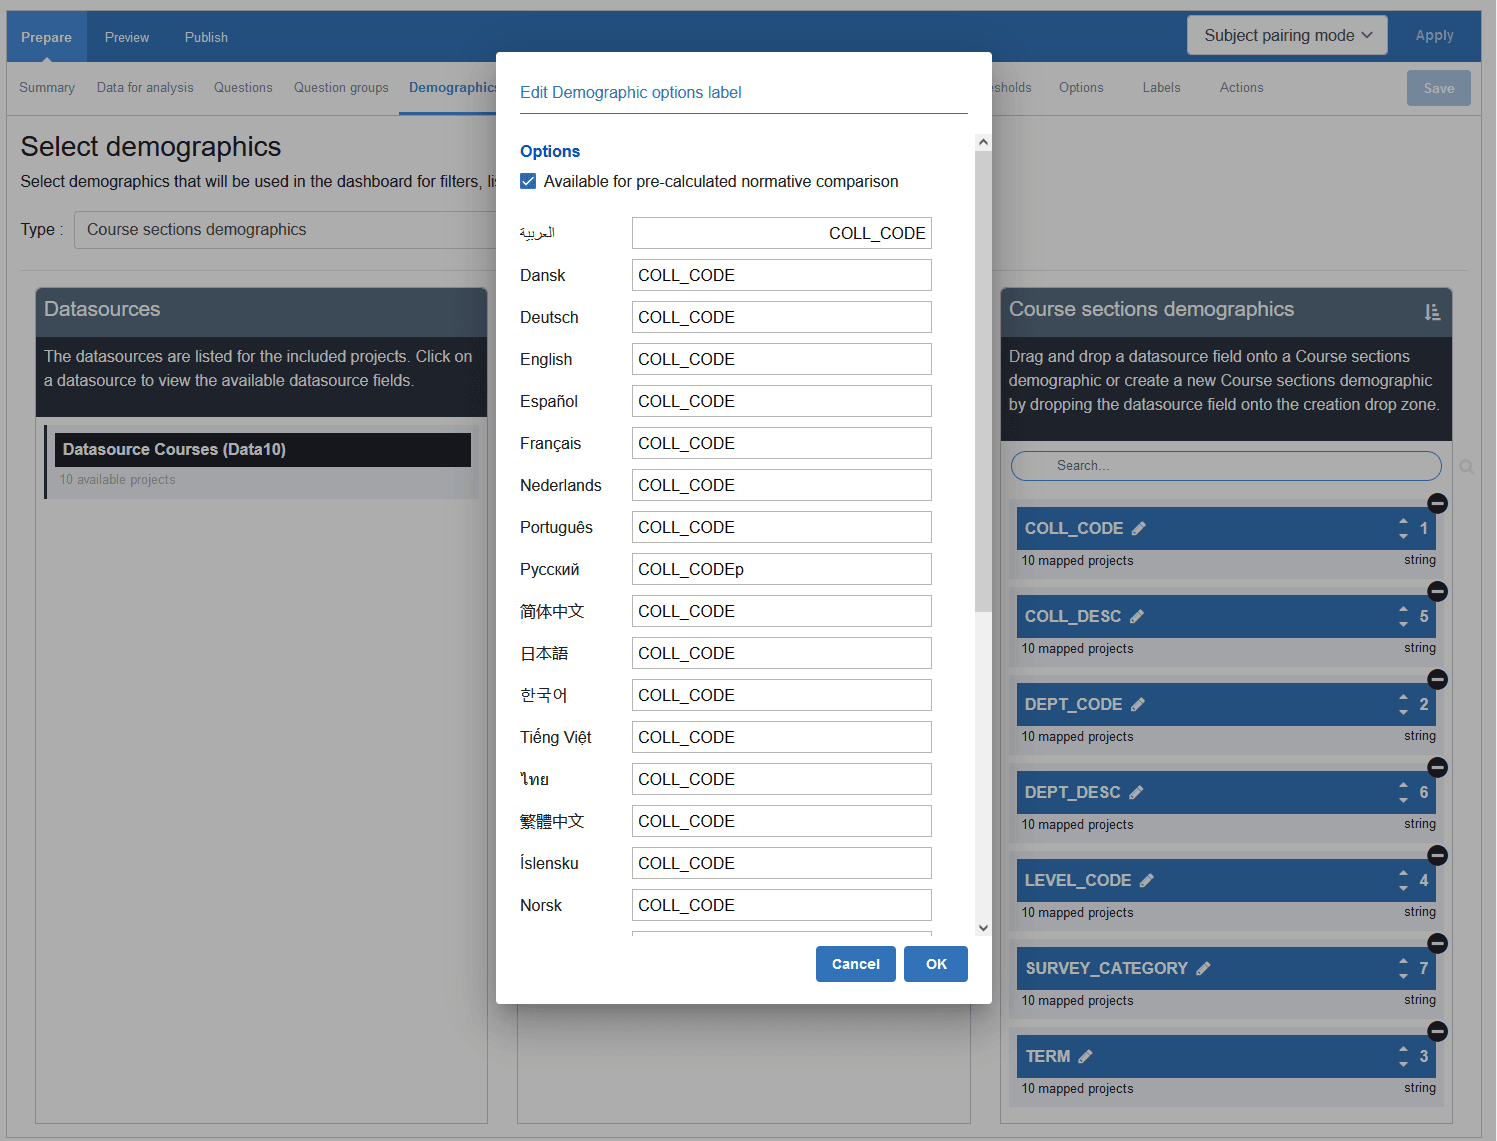
Edit dashboard demographics
Pre-calculated norms, display as additional subject information, and multilingual captions can be configured in this window.
To edit the caption of a demographic field select the pencil icon and a new edit demographic options label window will appear.
- Set multilingual captions
- Enable Available for pre-calculated normative comparison (optional)
- Enable display as additional subject information (available only for primary subject demographics)
Available for pre-calculated normative comparison
When a demographic field is selected for pre-calculated normative comparison, the Blue Dashboard will calculate the overall norm and percentiles for each value in this field during the data generation process.
This value allows the dashboard user to measure their results with a larger entity like a department or school. To maintain data privacy, the pre-calculated norm values will only be available to users with the appropriate access rights (i.e. a user in one department will not be allowed to access the norm values from another department).
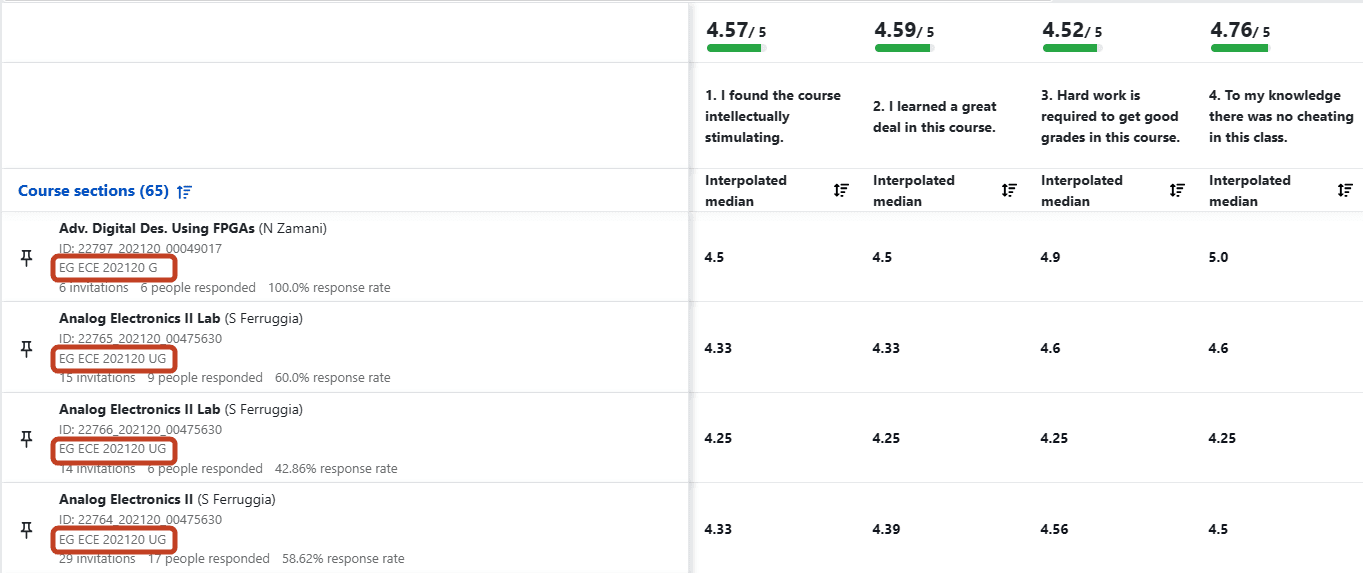
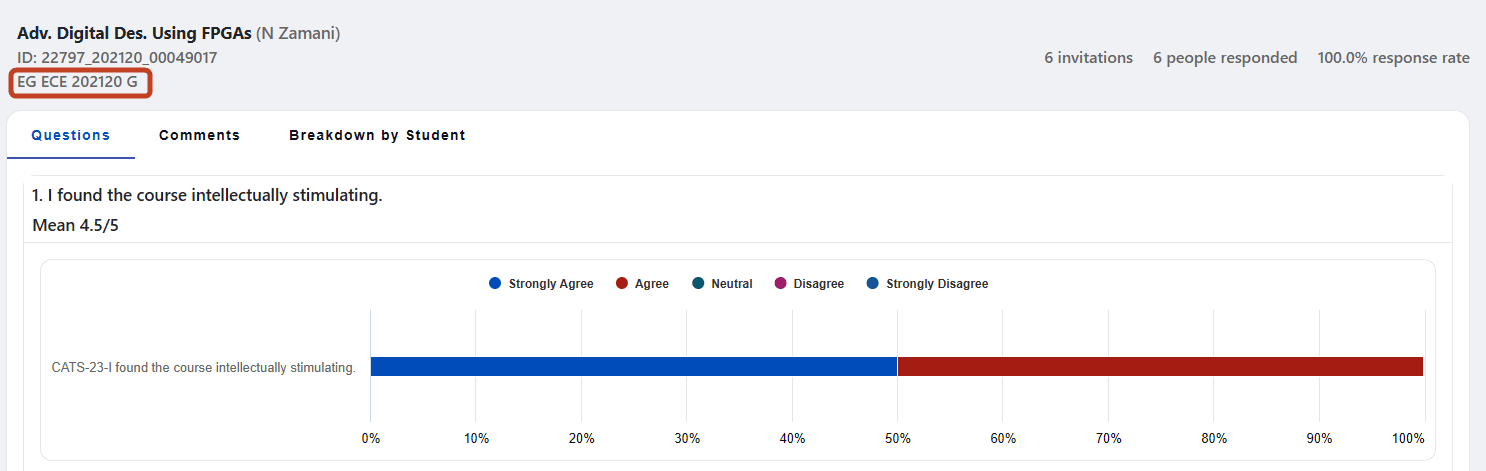
Display as additional subject information
When a primary subject demographic field is selected for display as additional subject information it will be displayed alongside the subject name/subject ID on the dashboard. When multiple fields are selected, the order of the fields can be set by modifying the priority of the fields in the demographics configuration. Fields are separated by a single space when displayed.
Using the Display additional subject information is especially useful when paired with the Hide subject ID from dashboard view option as it can serve as an alternative to the subject ID.