Report on demographic ranges
Many demographic fields contain integer data (i.e. age, number of children, annual salary, etc). Reporting on this data can be difficult because it is too granular, so instead values are grouped together into logical ranges (i.e. 5-10 years, 1-3 children, etc).
Using the demographic Report Block based on an integer value will allow setting ranges and cross-tabulating with other demographics and questions.
THINGS TO KNOW ABOUT RANGES IN DEMOGRAPHIC REPORT BLOCKS
- You can only report on ranges with integer type fields. Verify your datasource for integer fields. For more information on datasources, consult the following topic: Datasource Types.
- Demographic Report Blocks only provide analysis on subjects and raters that have responses.
Create a new demographic Report Block
- Go to Reports and select a report.
- Navigate to Content - Blocks.
- Next to Select Report Block Type, choose Demographics and select Add Report Block.
- Locate the integer field to report on and select the Chart and Tabular Options and enter the title for this block.
- Select Add to List.
- Select Edit next to the newly added block.
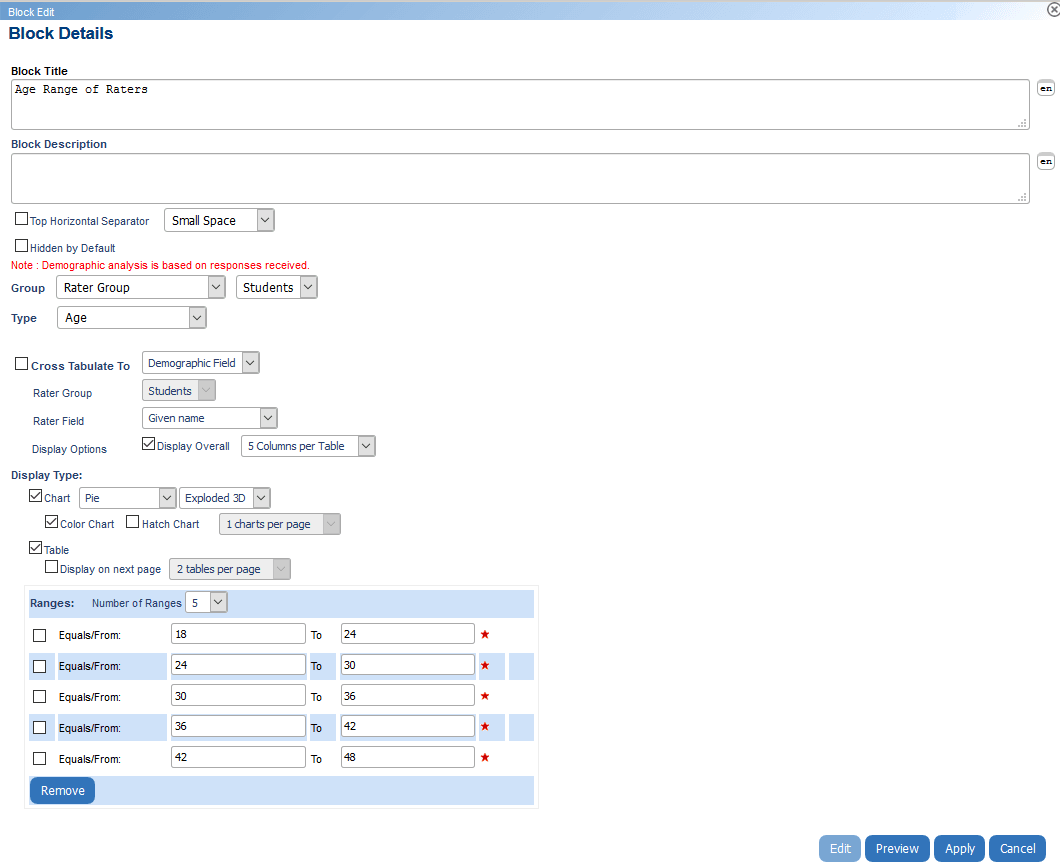
- Set the number of the ranges from the Number of Ranges drop-down list; Blue sets 5 by default.
- Adjust each range's min and max values.
- Select Preview to see the block with randomly generated results to confirm the layout.
- Select Apply to finalize and Save to save your changes.
Cross-tabulate ranges against other Demographics
Once you have configured the ranges in the demographic Report Block, you can cross-tabulate them against any other rater demographic or single selection question.
- Go back to the same block under Reports - Content - Blocks
- Select Edit next to the demographic report block
- Select the Cross Tabulate checkbox
- Select a Demographic Field or Question Statistics cross-tabulation from the first drop-down list
- Demographic Field - Select a Rater Field you would like to cross-tabulate against
- Question Statistics - Select the Question, Row, and Scale you would like to cross-tabulate against
- Select Preview to see the cross-tabulation layout
- Select Apply to finalize and Save to save your changes
BEST PRACTICE
- For more information on Demographics Report Blocks, consult the following topic: Demographics Based Report Blocks.
- Use the table with the chart option when using cross-tabulation to make it easier for report viewers to interpret results.
- When you select cross-tabulation, use the pie chart to report on demographics and use the Radar chart to report on rating questions.