Score plus trend widget
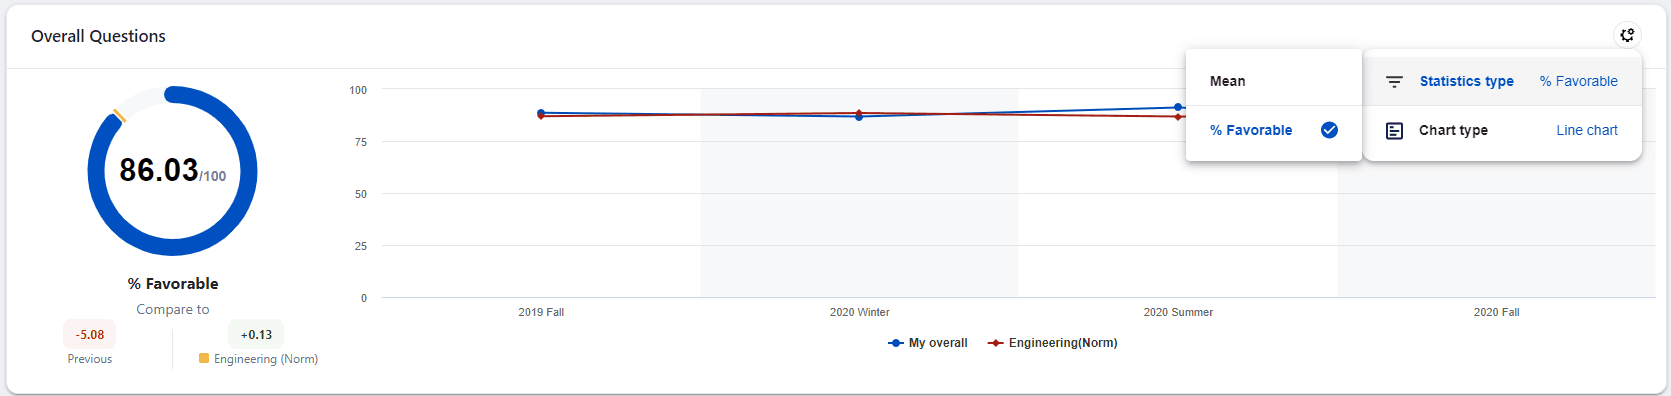
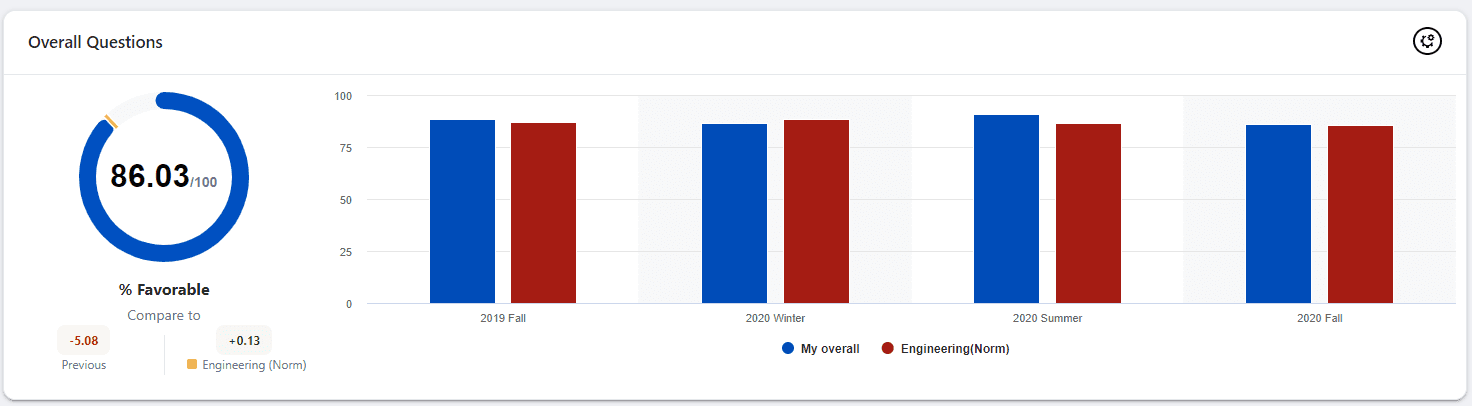
Displays a chart containing the score of a question or question group. This widget also includes the change from the previous score and the difference from the pre-calculated norm (optional). Users can change the displayed statistics by selecting different statistics within this widget. This widget also includes up to three time periods that are prior to the anchor time periods.
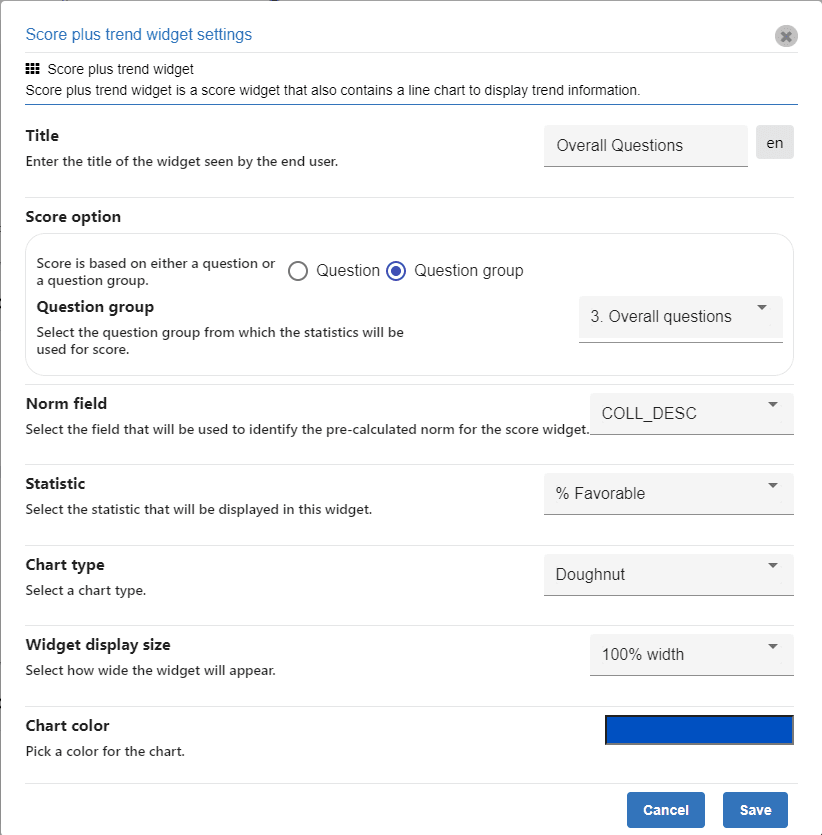
Title - Enter the title of widget. This title will be displayed to the end user.
Score option - Can be either question or question group (a question group is composed of more than one question).
Norm field - (optional) If selected the widget will display a pre-calculated norm based on the selected field and your data. Primary subject and secondary subject demographics defined in the demographics tab can be selected.
The norm element that is available is dynamically determined based on the loaded dataset. For instance, to view the school norm for engineering, all your courses must belong to the school of engineering. In order to show the norm element you must either load the data from one specific organizational unit or filters must be leveraged to narrow the data displayed to just one organizational unit.
Statistics - Select the statistic that will be displayed on the widget.
Median and interpolated median are not statistically appropriate for a question group that contains multiple questions. Because of this, median and interpolated median may not be available for a widget.
Chart type - Select either a doughnut chart or a horizontal bar chart to display the data.
Widget display size - Select how wide the widget will appear, by choosing one of two options, 100% width or 50% width.
Chart color - Choose a color scheme for the data displayed on the widget.