Statistical distribution report block
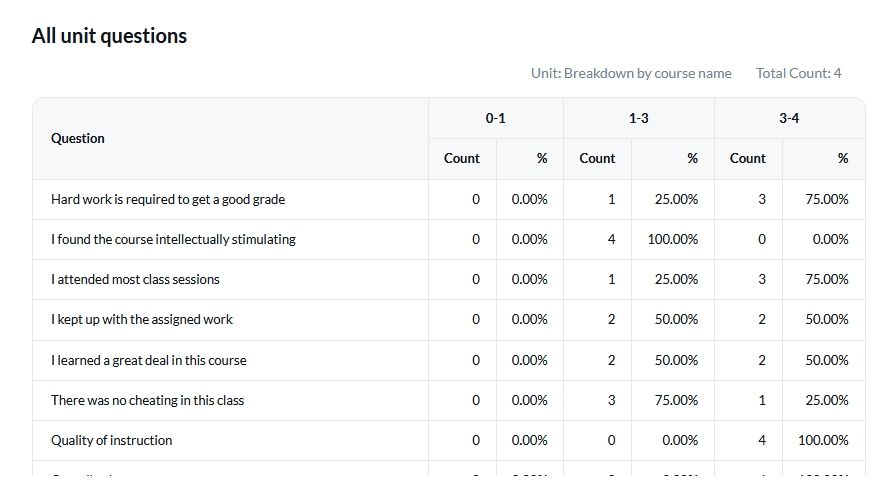
A Question - Statistical Distribution report block analyzes the responses for a specific question and displays the number of groups (colleges, departments, etc) whose mean or median results are within a certain range.
As an example:
- If each question in a course evaluation can have a response of 1-5.
- For each question, display the number of college departments that had a median result > 4.5. For these college departments, half of the responses to the question were > 4.5.
Question - Statistical Distribution report blocks
- Available for Single Selection, Single Selection Table and Virtual questions.
- For use in Rollover and Group by reports.
- Cannot contain response data from personalized questions.
- Cannot be created using surveys.
- The Question Title cannot be changed for a Question - Statistical Distribution report block.
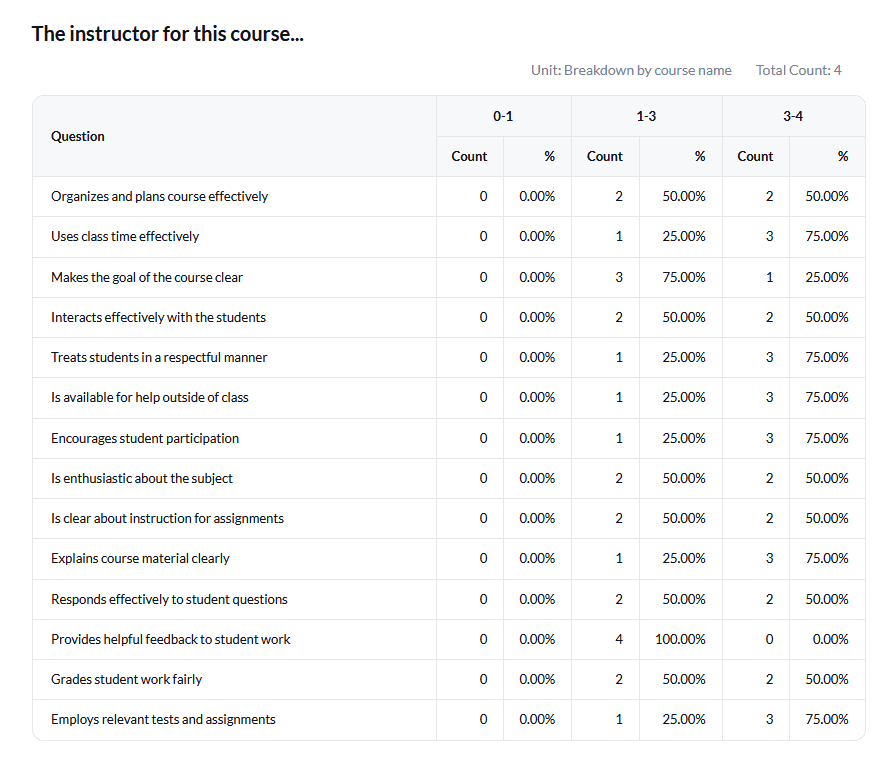
In this example, a Question - Statistical Distribution report block has been created by using a Virtual question which combines three Single Selection questions, where the first question has two scales.
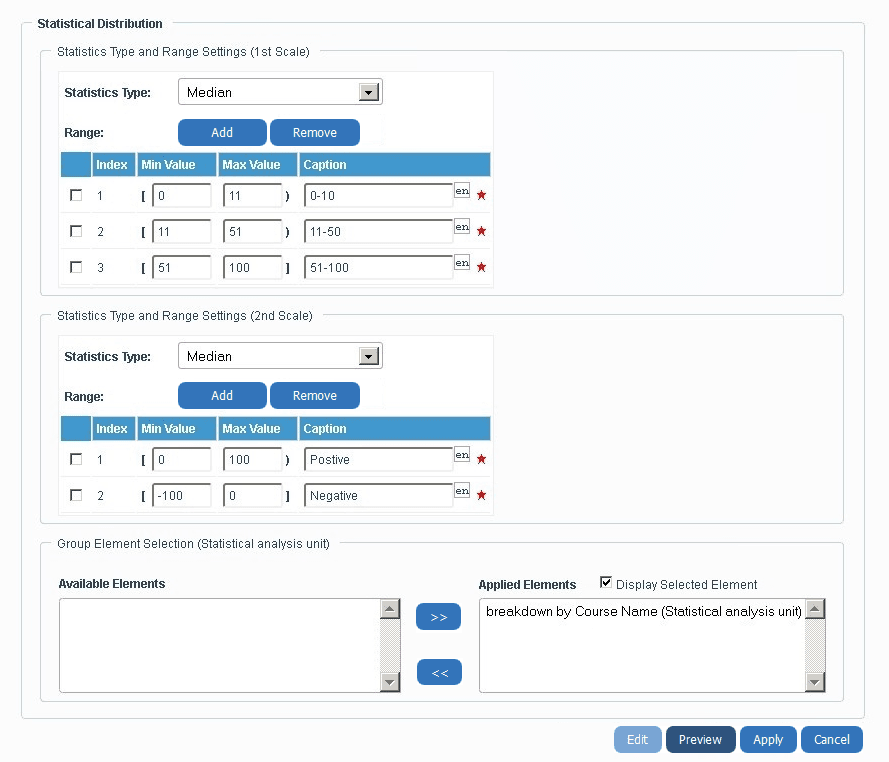
Statistics Type and Range Settings
Primary Scale - Click Add to select which scale point to include in the frequency analysis. The Remove button is used to exclude scale points from the question block.
- Select the Scale - Displays specific scale points or questions. For instance, only calculate the frequency based on a Median below 2.
- Caption - Label the scale point’s frequency analysis in the table (charts not available).
- Min Value and Max Value - The minimum and maximum values for this scale.
Secondary Scale - Click Add to select which scale point to include in the frequency analysis. The Remove button is used to exclude scale points from the question block.
- Select the Scale - Displays specific scale points or questions. For instance, only calculate the frequency based on a Median below 2.
- Caption - Label the scale point’s frequency analysis in the table (charts not available).
- Min Value and Max Value - The minimum and maximum values for this scale point.
- Group Element Selection - By default, each rating question will be displayed as a singular score represented by the sum of all raters divided by the total. This display mode will be used when the group elements box is empty.
If you have created a Statistical Analysis Unit group element, you can add them or remove them here. Adding the group element will display it in your report.
Display Selected Element - Displays the name of the group element in your report. This option is only available for Question - Statistical Distribution report blocks.