Time scales
Create time scales and then define time periods within the scales. At least one time scale must be created, but multiple time scales are supported (i.e. semester based time scales or year based time scales). These periods will be the time markers plotted on the Blue Dashboard graph.
There are two types of time scales, custom or standard. Custom time scales are defined by the administrators who can define time periods according to their needs, however, they must update the time scale manually to include the latest time periods. Standard time scales automatically generate time periods base on the data included in the dashboard, however these time scales are less flexible because they are automatically generated based on the calendar period.
Define custom time scales
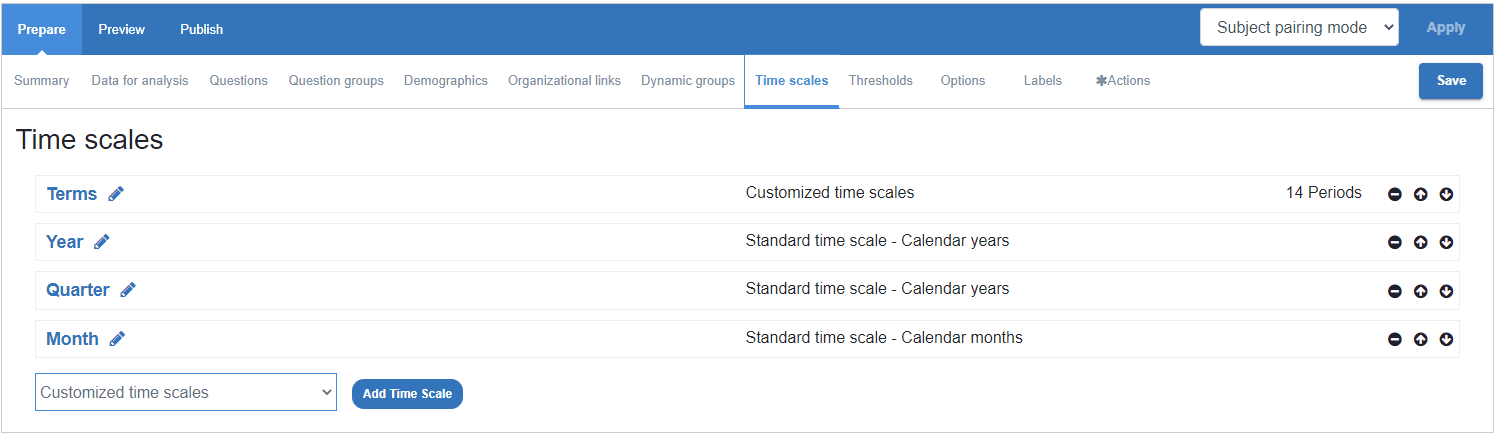
At least one time scale must be defined or selected in order for the dashboard to function. To create a custom time period, first create a custom time scale. The first-time scale to appear in the list functions as the default time scale loaded on the end user dashboards, move the appropriate time scale to the top of the list to make it the default.
Click on Add time Scale to create a new time scale. A time scale can contain any number of periods.
Create time periods for custom time scales
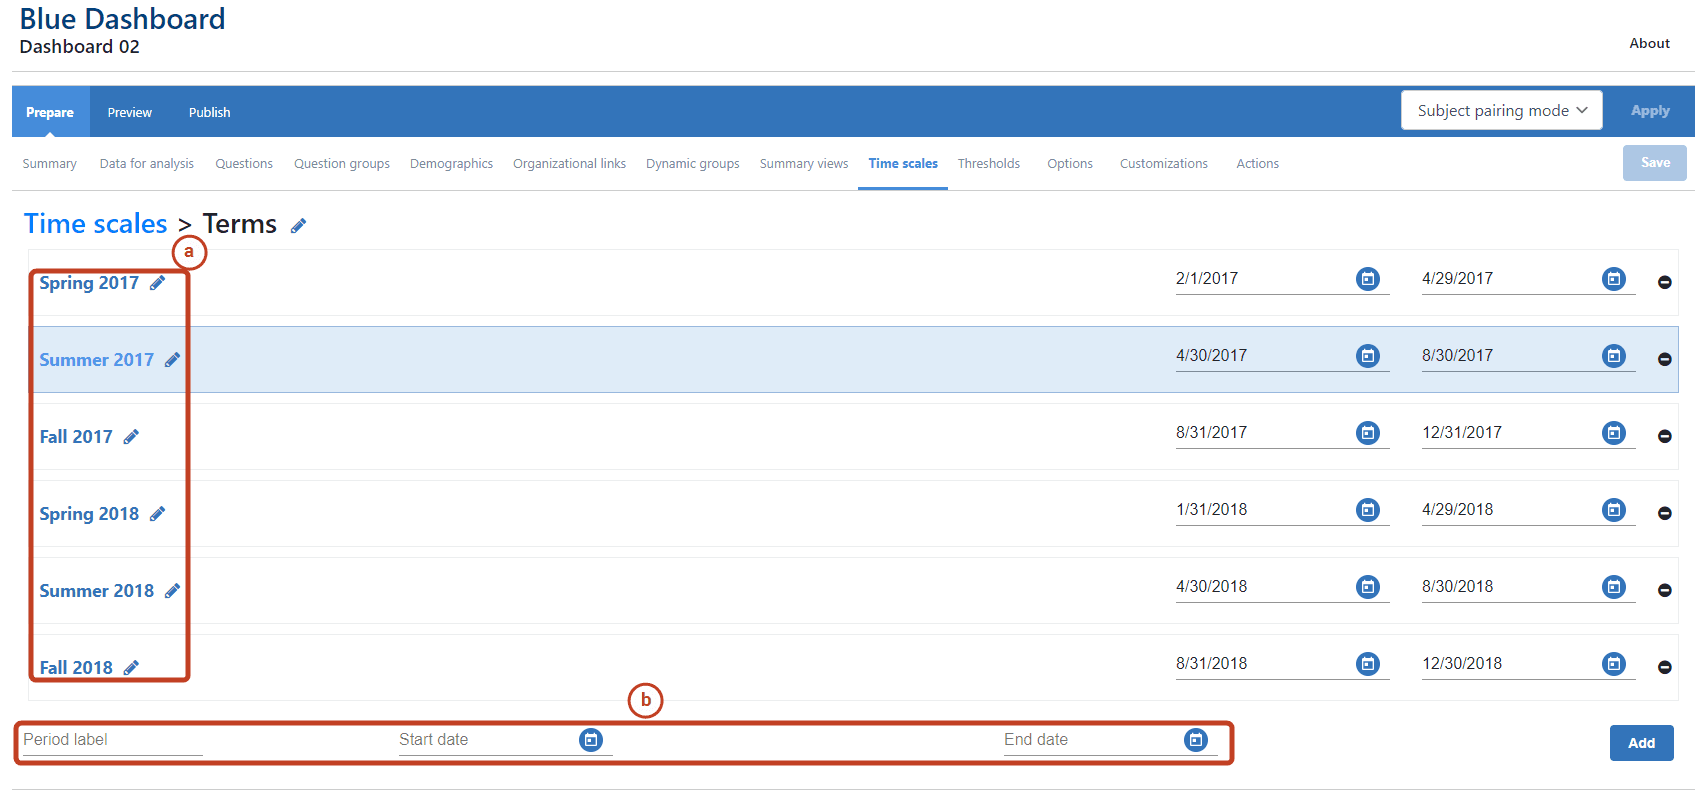
To view the details of a time scale, select the name of the scale.
- All the time periods are displayed with their name and date range
- Add a new time period by entering a name, choosing a start and end date, then selecting Add
- Date ranges for time periods within a time scale cannot overlap.
- Time period names must be unique.
- Periods are automatically listed in chronological order
Select a standard time scale
Blue Dashboard supports three types of standard time scales. The time periods will automatically adjust based on the latest data in the dashboard.
The three time scales are:
- Calendar months
- Calendar quarters
- Calendar years
- The time scale name can be modified by the admin and support multilingual access.
- Time scales are automatically generated and are always continuous.
- For example, if the earliest data is in 2018, the latest data is in 2022, the dashboard automatically creates continuous time periods for 2018, 2019, 2020, 2021, 2022, even though you might not have any data for 2020.
- Months follow the fully spelled out name of the month (for example - January. February, June).
- Quarters follow the format Qx YYYY (for example - Q1 2022, Q2 2022).
- Years follow the format YYYY (for example - 2021, 2022, 2023).
- Edit the name of a time period by clicking the pencil icon.
- Remove a time period by clicking the minus symbol (-).
- Use the calendar icon to pick a date instead of typing it in.