Add interactive widgets to a survey
Introduction
Interactive widgets allow you to display live survey results directly inside a survey using the BlueX Editor. This enables respondents and stakeholders to view data-driven insights in context, without relying on separate dashboards or reports.
What you can add
Interactive widgets supported in the editor include:
- Descriptive statistics (bar chart, pie chart, heat map)
- Data tables
- Comments tables
Each widget visualizes real response data and updates automatically as new responses are collected.
Note: The widgets in Survey Management - Widgets display similar features; however they are currently not interactive.
Where widgets can be added
These widgets can be inserted only on the main editor page of a survey.
They can be placed:
- As standalone blocks in the editor
- Inside custom grids and custom areas
Widgets cannot be embedded inside questions, answer choices, page breaks, or standard layout components.
How to add a widget
- Open your survey in the BlueX Editor.
- Locate widgets in the editor ribbon.
- Click a widget to insert it at the cursor position or drag and drop it into the layout.
- Select the widget to open the properties panel.
Once added, the widget appears as a standalone component in the survey.
Connecting widgets to survey data
From the Source data panel, you can:
- Select the source survey (current survey or another survey you have access to).
- Choose the question or variable (demographics, device, OS, browser).
- Select a published survey version to display data.
Each widget can use data from only one survey, but multiple widgets in the same survey can reference different surveys if needed.
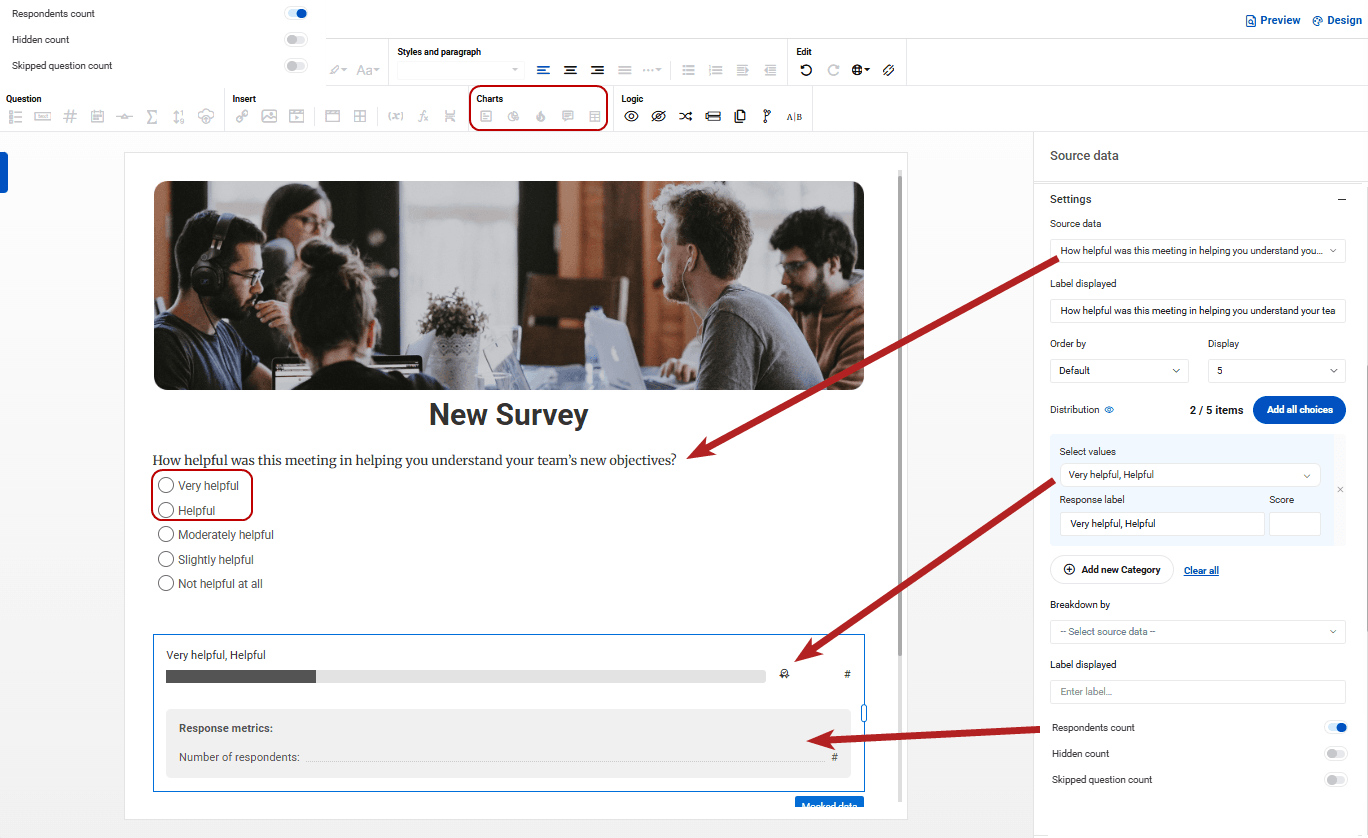
Previewing widgets before publishing
Widgets can be configured before the survey is published. When no response data exists, mock data is shown to help you preview layout, size, and visual design. Actual data appears automatically once the survey is published and responses are collected.
Using widgets in custom grids
When added to a custom grid:
- Only widgets that display summary statistics of survey responses are supported (bar chart, pie chart, heat map).
- Widgets can repeat across rows or columns based on grid settings.
- Repeated widgets share the same configuration and data source.
This allows you to build structured, multi-column layouts with consistent visualizations.
What happens if data changes
- If a linked question is deleted, the widget displays a warning that the source data no longer exists.
- Widgets always reflect the selected published survey version.
- Configuration changes apply immediately after publishing.
Why use widgets in surveys
Adding widgets directly to surveys helps surface insights at the right moment. They enable real-time feedback, richer storytelling, and more engaging survey experiences without requiring separate reporting workflows.