Setting Up the Descriptive Statistics Widget
The Create a widget pop-up is the entry point for visualizing survey data on the dashboard, providing a structured, guided workflow to configure widgets. When Descriptive statistics is selected as the widget type, the system displays four sections: General settings, source data setup, displayed statistic, and filters and conditions.
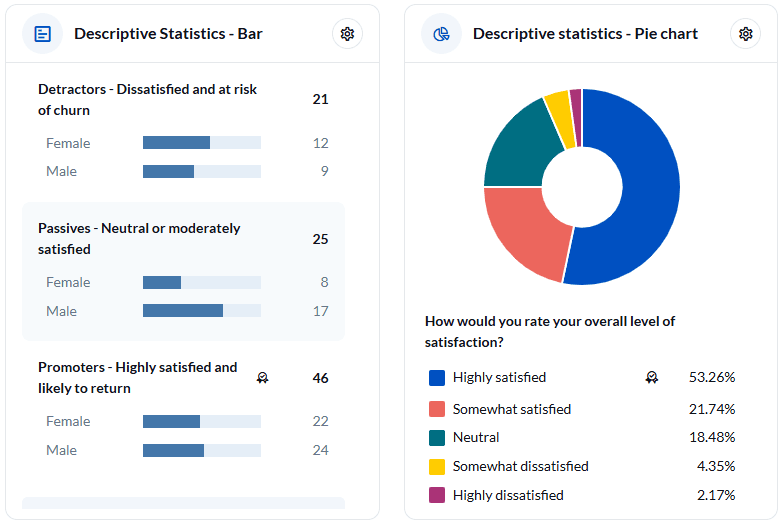
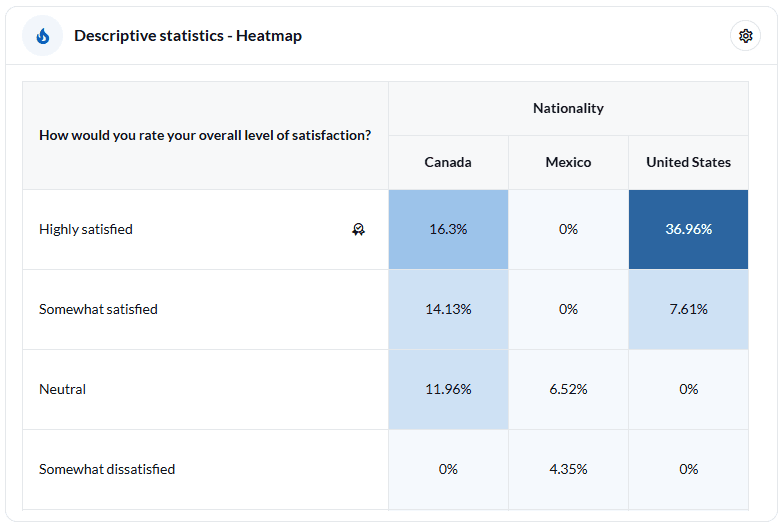
The descriptive statistics widget is designed to provide summary statistics such as counts, percentages, means, and medians, helping users understand patterns, distributions, and key insights from survey data.
Sample descriptive widgets
Step 1: General settings
In the General settings section, the user sets up the foundational elements for the descriptive statistics widget:
- Survey version: Select the survey version whose data will be analyzed.
- Widget type: Select Descriptive Statistics, designed for summarizing data.
- Title: Enter a clear, descriptive title for easy identification on the dashboard.
- Widget size: Define how prominently the widget appears within the dashboard.
- Chart type: Select a chart type suited to the descriptive statistics displayed, such as bar charts for distributions or line charts for trends.
Step 2: Source data setup
The source data setup section determines what data will be analyzed within the widget:
- Source data selection: Select the source data for analysis, which can include supported survey questions (choice, scale, comment, numeric, and date-time), as well as respondent demographic attributes.
- Label displayed: Create a custom label to be displayed on the widget. If the user does not define a custom label, the system automatically uses the default label based on the question selected in the source data.
- Order by and display: Users can specify:
- No sorting (default): To maintain the original order of segments.
- Sort by segment label: To sort segments alphabetically in ascending or descending order.
- Sort by distribution count/percentage: To sort segments based on response counts or percentages in ascending or descending order.
Users can also choose how many results to display in the widget after sorting, with configurable options of 5, 10, 15, 30, or 50 results.
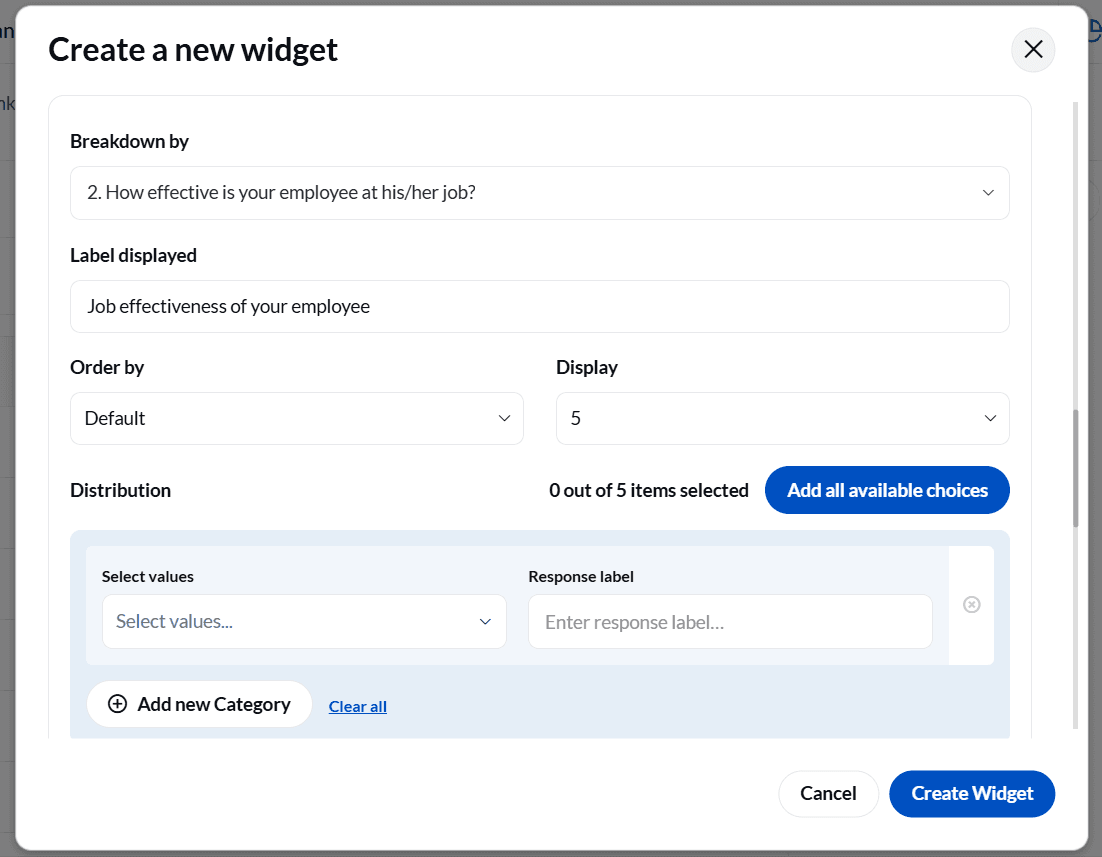
- Breakdown options: Apply Breakdown By, selecting another survey question or demographic attribute to break down the data. Additional fields, including label displayed, order by, and display, also appear within this breakdown configuration.
- Display distribution by and response distribution on: Use these options to display percentage distributions across segments, providing insights into how responses are distributed within and across groups.
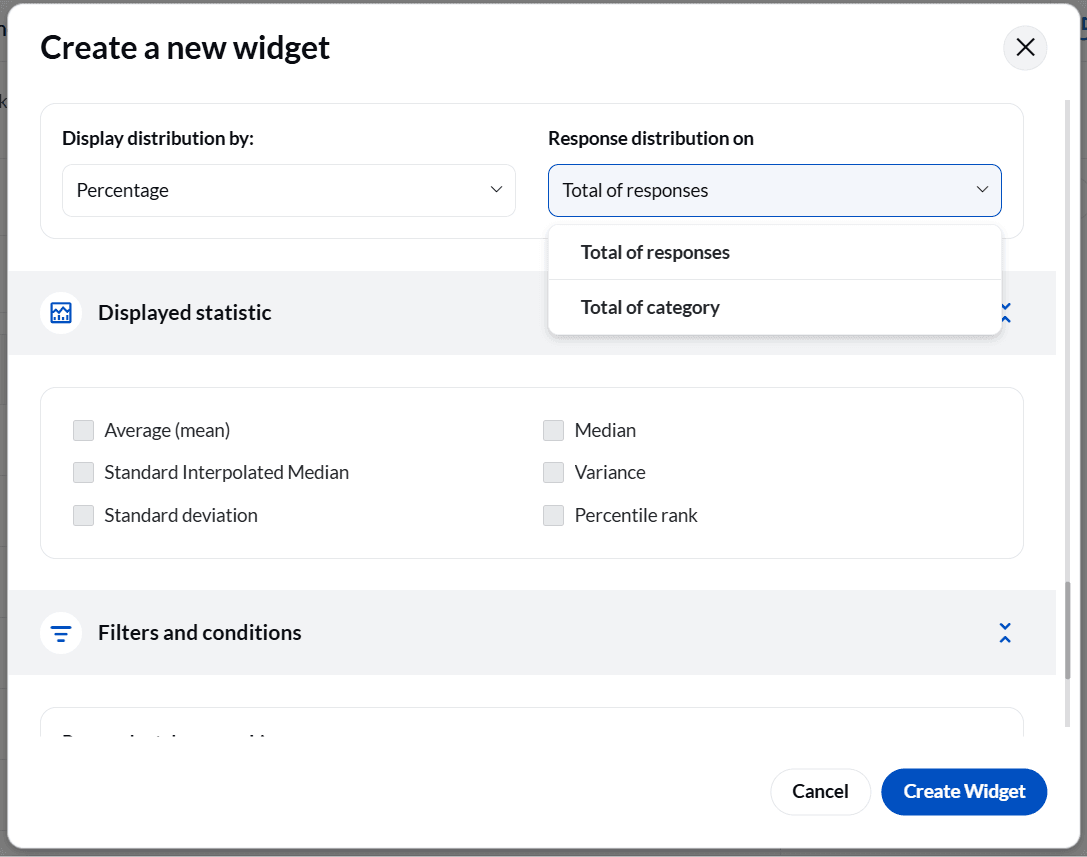
Step 3: Displayed statistic
The displayed statistic section is for defining which statistical measures will be shown in the widget.
Available metrics include:
- Average (Mean): Calculates and displays the arithmetic mean of the selected numeric data, providing a sense of overall central tendency.
- Median: Displays the middle value in the dataset, offering a robust measure of central tendency, especially useful in skewed distributions.
- Standard interpolated median: Provides a more precise median calculation for ordinal scales, helpful for nuanced analysis in scaled survey responses.
- Variance: Measures the variability of the dataset, helping to understand how spread out responses are.
- Standard deviation: Displays the dispersion of data around the mean, useful for comparing variability across different datasets.
- Percentile rank: Indicates the relative standing of a particular value within the dataset, offering context within distributions.
The user can select one or multiple metrics depending on the type of analysis required, enabling layered insights from simple counts to advanced distribution analysis.
Step 4: Filters and conditions
The Filters and conditions section allows users to refine the data displayed in the descriptive statistics widget. Filters, including browser, device, and operating system, are also available to provide additional context while protecting respondent privacy by excluding identifiers like first name, last name, and email. For advanced filtering needs, users can utilize the condition builder within the application.