Introduction to widgets
Widgets in BlueX offer a robust solution for analyzing and presenting survey data within the platform. They convert responses into visual insights using charts, tables, filters, and comment displays. They support statistical summaries, cross-tabulations, and real-time updates. Ideal for course evaluations or institutional insights, they help make data clear, organized, and ready for presentation.
Widget access requirements
Only users with the appropriate privileges can create widgets. To qualify, a user must:
- Have access to the Responses and Export History of a survey
AND - Have publishing rights, either to Publish self-created surveys, or Publish any survey within the organization
This ensures that widget creation and data visualization are limited to authorized users.
Create a Widget
Widgets can only be created after a survey has been published, to ensure that all question structures and IDs are finalized.
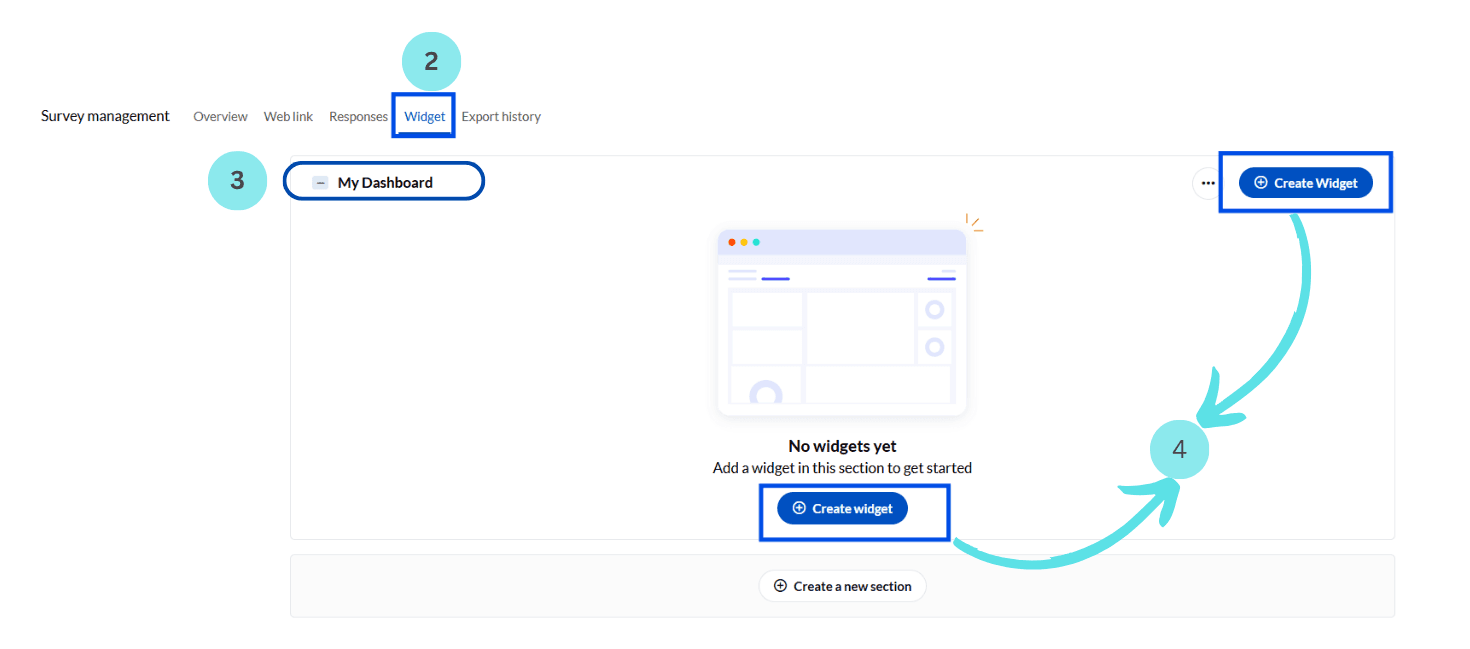
- Select the survey you would like to work on and navigate to the Survey management tab.
![]()
- Click the Widget tab to access the widgets interface. Here you can view, create, or manage widget sections and individual widgets.
Widgets must reside within a section, which serves as a logical container for organizing related data visualizations (e.g., “Demographics,” “Instructor Feedback,” “Outcomes”). See the dedicated Sections documentation for full capabilities like drag-and-drop ordering, section renaming, and more.
- The system presents a blank canvas with a default section titled My Dashboard and a button labeled Create new section to create additional sections.
- Click Create widget to open a pop-up.
In the popup, choose the survey version, widget type, and enter a title. Select relevant survey questions, configure display options such as size, segmentation, statistics, and filters (filters are available for private surveys only).
Once saved, the widget will appear inside its assigned section and will update automatically as new responses are collected.
Copy to clipboard feature
The Copy to clipboard feature in BlueX widgets allows users to capture high-resolution snapshots of any widget for use in external reports, presentations, or design tools by clicking a copy icon. The captured snapshot excludes scroll bars and indicators, and although applied filters affect the data shown, they are not visibly marked on the image.
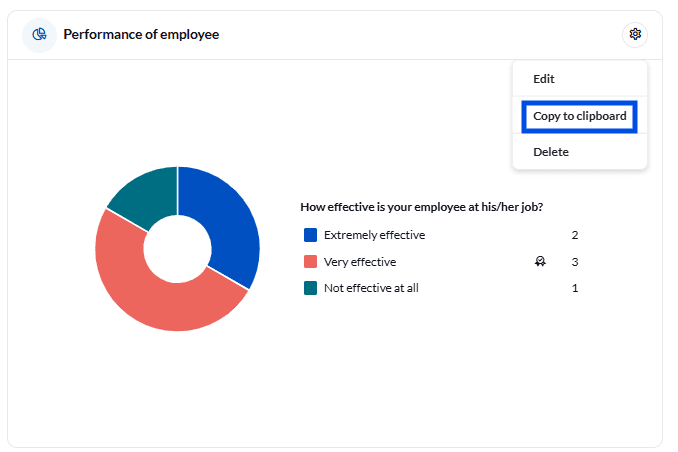
The copied image is saved in either PNG or JPEG format, ensuring the images are high quality and compatible with tools like Microsoft Word, PowerPoint and others. Only one widget snapshot can be stored on the clipboard at a time, so copying a new one replaces the previous image. Once pasted, the image can be resized to suit the destination.