Analysis overview
The Overview presents key insights from your analysis using graphs, bars and pie charts to highlight important sentiments, recommendations, alerts and topics to help you quickly grasp which insights matter the most to your employees and students.
Each total, attribute and topic is clickable which enables you to dig deeper into the results to reveal issues and blind spots, spot trends, and discover recommendations that can help you quickly make decisions and take action, when needed.
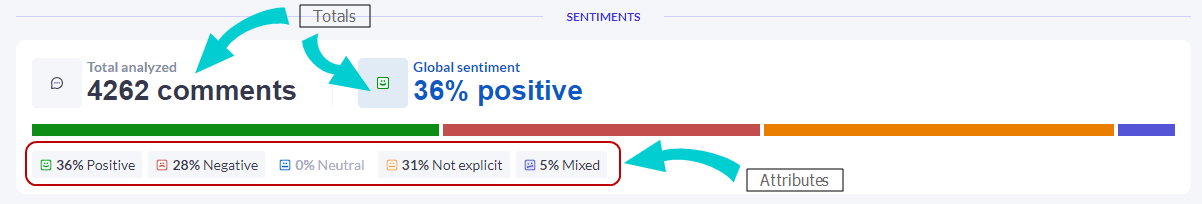
Sentiments
Global sentiment refers to the overall tone of the comments analyzed. Is it primarily positive or negative? Are you noticing a negative trend in sentiment over time?
All comments that are analyzed are assigned a sentiment.
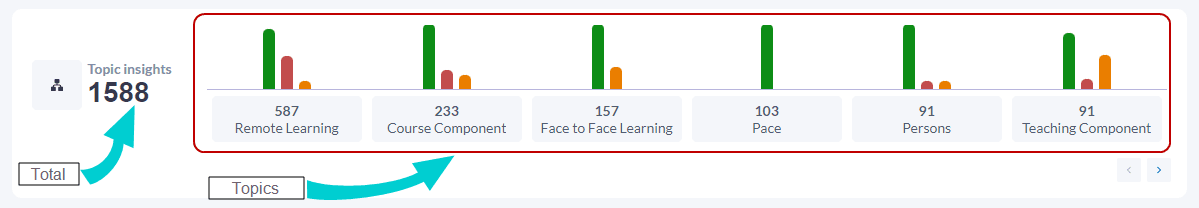
Which topic insights show high negative or mixed sentiments? The topics provide an indication of which areas to explore for more details.
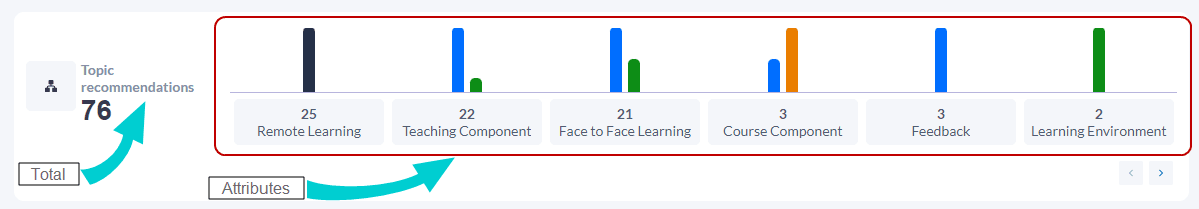
Recommendations
How many recommendations were uncovered? Are employees or students engaged enough to suggest ways to improve their experiences? Which recommended action is most prevalent?
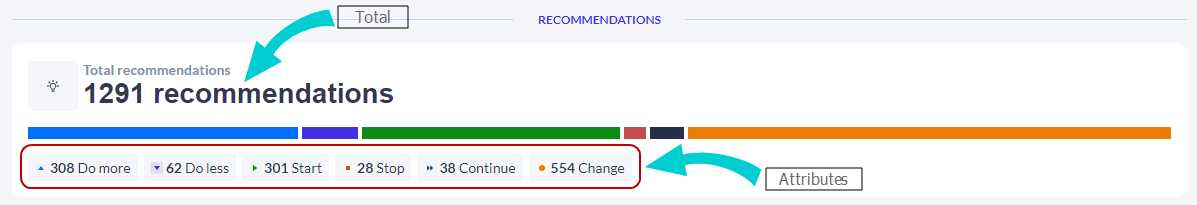
Which topic areas were linked to recommendations?
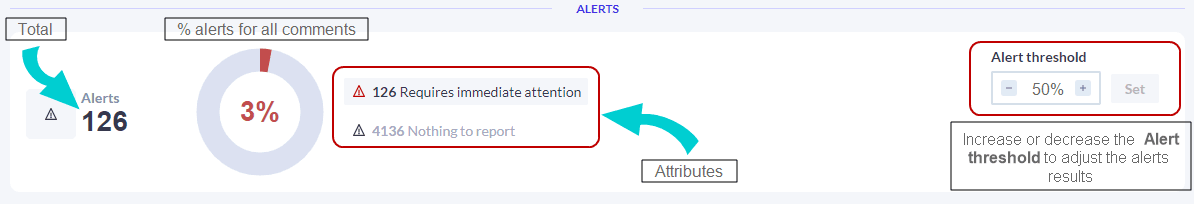
Alerts
How many alerts were detected and what percentage does this represent of the total number of comments analyzed? Also, how many alerts require immediate attention?
During the analysis process, all comments are measured and given an alerts % score. Comments that have scores less than the Alerts threshold will not be considered alerts that requires immediate attention and will not be included in the total number of alerts, nor in the calculation of the % alerts for all comments.
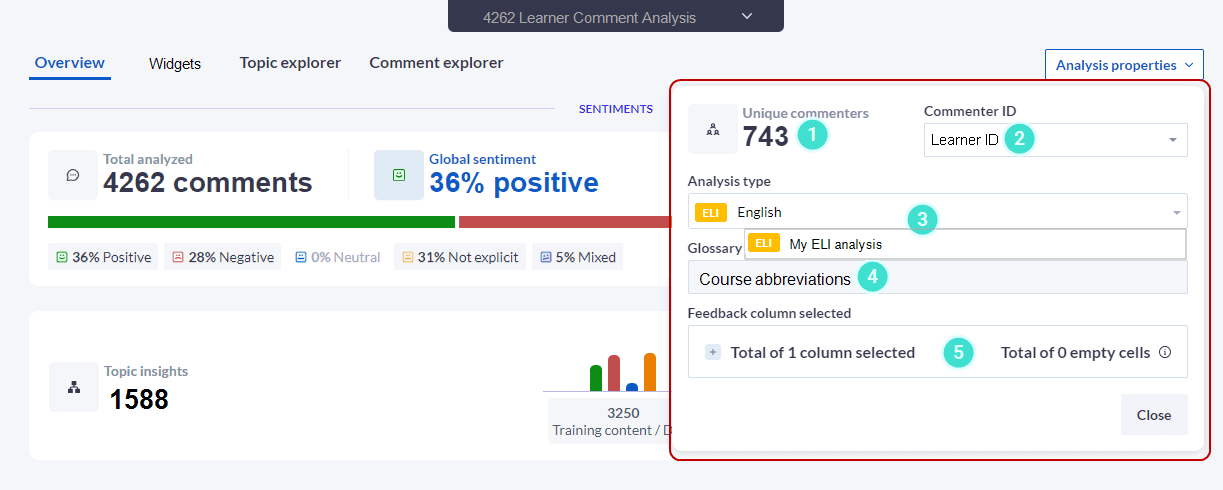
Analysis properties
This pop-up window provides a quick summary of the parameters used to analyze your comments.
- If your data file contained demographic information related to the individuals who completed the survey / questionnaire, this column could be used to provide a count of the number of Unique commenters.
- Commenter ID shows which the type of demographic information used.
- The Analysis type displays the analysis used and the Customized analysis type linked to your base analyses type. See Things to know note below.
- Glossary displays the name of the glossary used (if selected).
- Feedback column(s) selected - This section provides the Total of the columns selected with the header names of each column and the Total of empty cells detected.
- Empty / blank cells are excluded from the analysis.
- If you have created a customized analysis type and have used it in the past, it will be linked to your base analysis type (ELI, EEI, or SEI). During the initial analysis, the customized and the base analyses are run at the same time. This facilitates the use of the customized analysis later by reducing the time needed to display the results and the comments analyzed are not counted in the analyzed comments licensing limit. See the Analysis properties example: