Comparative Performance Legacy Report
The Comparative Performance reports shows overall survey results (quantitative averages) organized by standard fields. These reports will roll up data for multiple classes and include a benchmark indicator to make it visually simple to determine which line items in your report are performing above and below your average. Running a Comparative Performance report at the most basic level will produce overall scores for all line items in the report, which you can drill down to through the form type, question category, and question levels to understand what lower level numbers are making up your higher-level results. Comparative Performance reports allow custom filtering to limit your dataset to specific training assets or combinations of assets to increase your reporting power and abilities.
In addition, you can click on a line item in the report at any time to access Class Detail, or a list of classes that had data for that line item and the score for each class in that report level (overall, form, question category or question). Because of the expanse of data these reports can calculate in a short time frame, Comparative Performance reports can be useful running daily for the previous day's training, weekly for the previous week, monthly for the previous month, and so on. This versatility also makes them valuable to all members of your training organization.
Note: MTM pre-generates several different report queries for Comparative Performance reports during the overnight system processing. Requesting a report for a month (based on a calendar month from the 1st of the month to the last day of the month), quarter (based on a January - December calendar in which January 1 through March 31 is the first quarter), or year (based on a January - December calendar year) is likely to complete more quickly than reports generated for time frames other than those listed. However, these pre-configured date ranges will not prevent you from using customized dates as needed for your reports.
Procedure Steps
- Navigate to Legacy > Legacy Reports to display all available Legacy reports.
- Click the Show all reports link in the Find a report section of the left navigation menu. A list of all reports will display in the right pane.
- Click the Comparative Performance link.
- Configure your query as desired and click Generate Report. Note the additional configuration options that go beyond the standard query generation fields as defined in the Accessing MTM Reporting Help Guide:
| Field Name | Field Description |
|---|---|
| Report Output | Your options are standard auto-email, graphical output or a tabular-display format. |
| Report Type | Select which training asset you want your results aggregated by. |
| Minimum number of evaluations | If you prefer to limit your report to items with a higher volume of evaluations, input the minimum number of evaluations each item must have to be displayed in the report. For example, if you wanted to see a Comparative Performance by Instructor but only include instructors who have at least 10 evaluations, you could enter 10 here to reduce the amount of instructors included in your report. Note: If you choose to apply a minimum number of evals to a Comparative Performance report, the n-count and score for the My Average item in the report will reflect your full dataset (includes items that had fewer than the minimum required to display in the report) |
| Current Benchmark | Your default benchmark settings are displayed here. The 'change' link allows the user to change the benchmark. This functionality applies to only the current report. Once you navigate away from this window, the benchmark setting will return to the default settings. The options available are: Only My Company, Everything Except My Company, Everything Including My Company, Peer Benchmarks (formerly Vendor Category, Custom Benchmarks (Formerly Specialized Benchmark), and Optional Benchmark Attributes added to the External Benchmarks. |
| Benchmark Display | Choose whether you want your results compared to My Average (your organization's overall score for the dataset) or the MTM Benchmark (set in User Preferences) in the report. Whichever option you don't select will display above the report area as a reference but will not be applied to your report layout. |
| Apply Filter to Benchmark | When checked, MTM will apply the filter criteria you select to your own data set to the benchmark dataset as well. If you do not choose to customize the benchmark, the system will generate its results based on all form types' data. For more information about using benchmarks, refer to the Filters section of the Accessing MTM Reporting Help Guide. |
| Select a Date Range / Start and End Date | Select the time frame you would like to include in your report. These dates are required. The following are the selection choices: Custom Date Range: Enables the start and end date selectors to further customize report data. Yesterday: Previous calendar day Week - Current: Sunday through Saturday of the current week Week- Last: A full calendar week of Sunday through Saturday Month - Current: Current calendar month Month - Last: Previous calendar month Quarter - Current (Fiscal): Determined based on an organization's fiscal start date. For example, the fiscal start begins in Feb and the current quarter would be Feb-Apr. Quarter - Last (Fiscal): Determined based on an organization's fiscal start date. For example, the fiscal starts in Feb and the last quarter would be Nov-Jan. Year - Current (Fiscal): Determined based on an organization's fiscal start date. For example, the fiscal start begins in Feb, therefore the current year would be Feb-Jan. Year - Last (Fiscal): Determined based on an organization's fiscal start date. For example if the fiscal start begins in Feb, last year would be the previous Feb-Jan. Quarter - Current (Calendar): Follows the calendar months for quarters. For example, if current month is Jan, the current quarter would be Jan-Mar. Quarter - Last (Calendar): Follows the calendar months for quarters. For example, if the current month is Jan, the last quarter would be Oct-Dec. Year - Current (Calendar): Follows the calendar months of the year of Jan-Dec. Note: An organization's fiscal calendar needs to be configured in order to utilize the options listed above that are noted as Fiscal. Contact your KA services representative to configure your fiscal calendar. If your organization's fiscal calendar is January, then those options that are noted as Fiscal will not display in the dropdown. |
| My Filters | You can apply the filters that were either set in My Filters tab or use the single use filter. |
Interpreting the Comparative Performance Report
Comparative Performance Reports display average scores aggregated by the Report Type selection you made on the query generation screen. Items are listed from best to worst performance. You can drill into a form type, question category, or question to view your results by a specific aspect of training evaluations. Your results will be compared to the benchmark selected for display, and the other benchmark value you can access will appear in the upper left corner of the report area for easy comparison.
When viewing the report, the vertical green bar will reflect the benchmarking option you selected. My Average represents your organization's average for the dataset. MTM Benchmark represents the value of your MTM benchmark setting (set in My Settings tab). Items in your report will display graphically, going horizontally, to the right of the green vertical bar if the score performed better than the benchmark value, or to the left if its performance fell below the benchmark value.
The report will show up to 50 items per page. If your report produces more than 25 items, you will have the option to scroll through 50 at a time or View All in a single report using the links at the bottom of the report area.
You can view Class Level Detail (a list of classes with data that was included in the dataset) for any item by clicking on the text of the item in the report area. You may drill into results for a single form type or question category from the main level of the report. Once drilling into a question category level, you will be able to limit your dataset by a specific question in the question category you drilled down into.
Return to a previous level of the report by clicking the Parent Report: Comparative Performance link at the top of the report area.
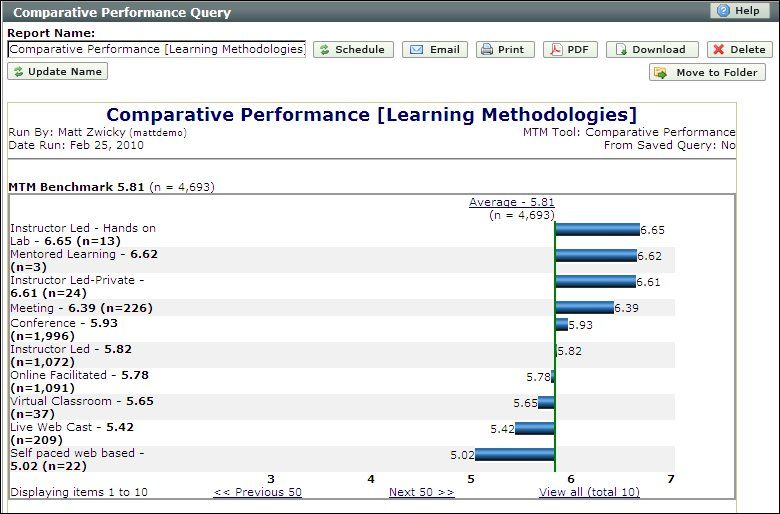
Figure 1 - Comparative Performance report run by Learning Methodologies. - Comparative Performance Reports display average scores aggregated by the Report Type selection you made on the query generation screen. Items are listed from best to worst performance. You can drill into a form type, question category, or question to view your results by a specific aspect of training evaluations. Your results will be compared to the benchmark selected for display, and the other benchmark value you can access will appear in the upper left corner of the report area for easy comparison.
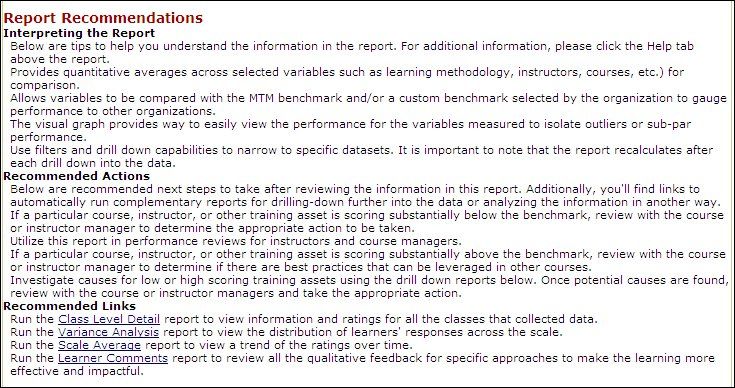
Figure 2 - Use the Recommended Links and Actions section to better assist in interpreting the report and run reports that compliment the Comparative Performance report.
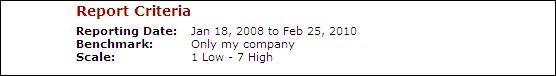
Figure 3 - View the criteria used in your query to make your dataset more identifiable
Interpreting the Report
Comparative Performance Reports show quantitative averages to compare the results of various training assets. When generating to graphical display, the vertical score that appears is based on your benchmark display selection from the report query tab. It provides for an easy visual understanding of which items in the report performed above and below the average. This can help you identify exceptions to your overall performance to isolate any potential problems or recognize top performers. A second benchmark will appear above your report so you can compare that information as well. Therefore, if you chose your average as the benchmark display, then the vertical score would match the overall score for your organization; above the graphical area of the report, you would be able to see the MTM Benchmark value for easier comparison and faster access to more complete benchmarking information.
When Comparative Performance Reports are first generated, the first screen of the report will be the overall results of your original query. If you generated the report with no custom filtering options, then the report will display results based on question categories on all form types combined. Each time you click a link to a form type or question category below the report graphic, you will be drilling into that level of the report and recalculating your scores for each line item by the new form, question category or question. When drilling into the question category level, links for individual questions will appear at the bottom of the page, below the graph. Questions that are not quantitative (such as questions that had a multiple choice response) will also appear here. Clicking on these multi-question text and each of the responses available to students along with the number of students who selected each response and the percentage of the population they make up.Common Applications of Comparative Performance.
Common Applications of Comparative Performance
There are many ways to run Comparative Performance Reports, but how do you know which is the best one for what you want to do? Below are several examples of useful ways to run the reports:
- Compare Instructor Performance: Generate a Comparative Performance Report by Instructor. Use the custom filtering options (in My Filters) to limit the report to the Instructor Question Category. This will allow you to compare your instructor score by the part of the evaluation that applies most to them, and their scores will not be inflated or deflated due to higher or lower scores in other areas of the evaluation. Comparative Performance Reports by Instructor are a great way to motivate instructors for contests, bonuses and awards.
- Compare Class Quality: Run a Comparative Performance Report by Class. Use the custom filtering options to limit the report to the question categories focused on satisfaction and quality - courseware, environment, instructor, and overall satisfaction (when applicable). This will allow you to see a snapshot of Level 1 (satisfaction) indicators for training. You may also want to run the report by learning provider or location to compare satisfaction at the different places where your training occurs.
- Compare Course Content: Run a Comparative Performance Report by Course. Use the custom filtering options to limit the report to the Courseware question category. Much like when running a report by instructors limited to the instructor question category, this will allow you to view results from the survey that apply most to the course content.
- Compare Learning Provider Performance: Run a Comparative Performance Report by Learning Provider. To view class results for each learning provider you are responsible for, click on the name of the Learning Provider to access Class Detail and see a list of classes held during the reporting date range.