Conference Dashboard
Overview
Introduction to the Conference Dashboard
The Conference Dashboard provides users with an overview of an entire Blended Learning Program for both its overall program level survey and session surveys as well as aggregate results. Using this template can help you answer questions such as:
- Did the training provided during this program have the expected business impact?
- What barriers to applying this new knowledge did the participants disclose?
- Was the content appropriate for the participants who attended?
- Which sessions were not highly recommended, and what could be done to improve or replace them for our next program?
- How well were the presenters received, and how will those results influence the selection of presenters at future programs?
To access the Conference Dashboard, users require licenses for the Blended Learning module and Dashboards.
How can I use this dashboard?
The Conference dashboard template can be used to identify and share high and low performing key metrics and question categories to identify successes as well as areas of improvement. It also contains individual session and instructor performance.
The Conference Dashboard template is intended to be used to monitor a single Blended Learning Program. However, it could be used for events such as a regional executive training program where all the programs took place around the same time. To compare multiple programs over an extended period of time, use the Data Explorer tool. Click here for more information about Data Explorer.
Who should use this dashboard?
Anyone who is responsible for analyzing training impact and driving continuous improvement of your Blended Learning Programs can benefit from the Conference Dashboard.
Job aid
The following information will help you understand how to interpret and use the Conference Dashboard.
What does this dashboard include?
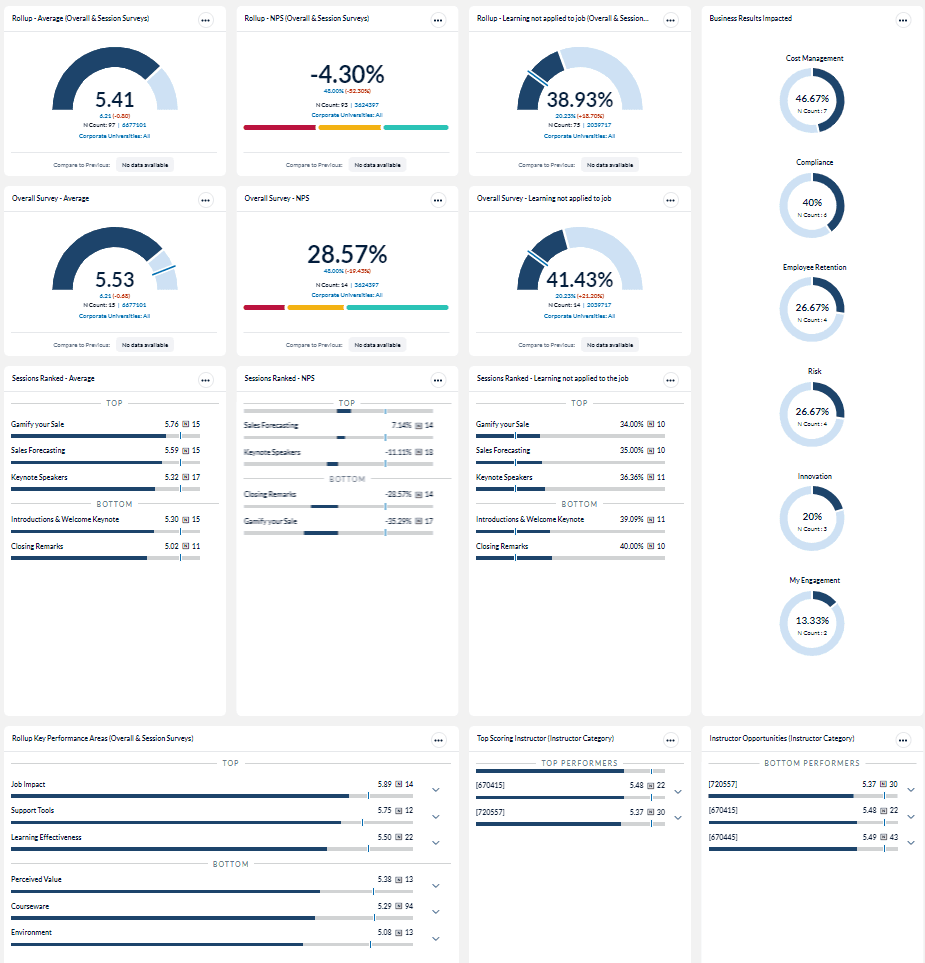
The Conference Dashboard contains KPIs broken out by:
- Overall Program(Overall & Sessions)
- Program Level Survey
- Session
The key metrics used in these sections provide immediate access to Blended Learning Program results at multiple levels. This can help you monitor your program as it progresses allowing you to proactively identify outliers or exceptions in order to take action if required, and to evaluate the results after the program is completed to plan for continuous improvement of your next event.
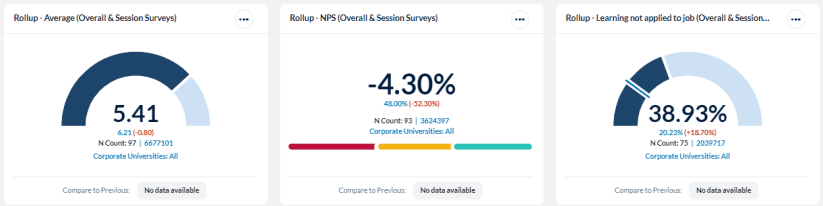
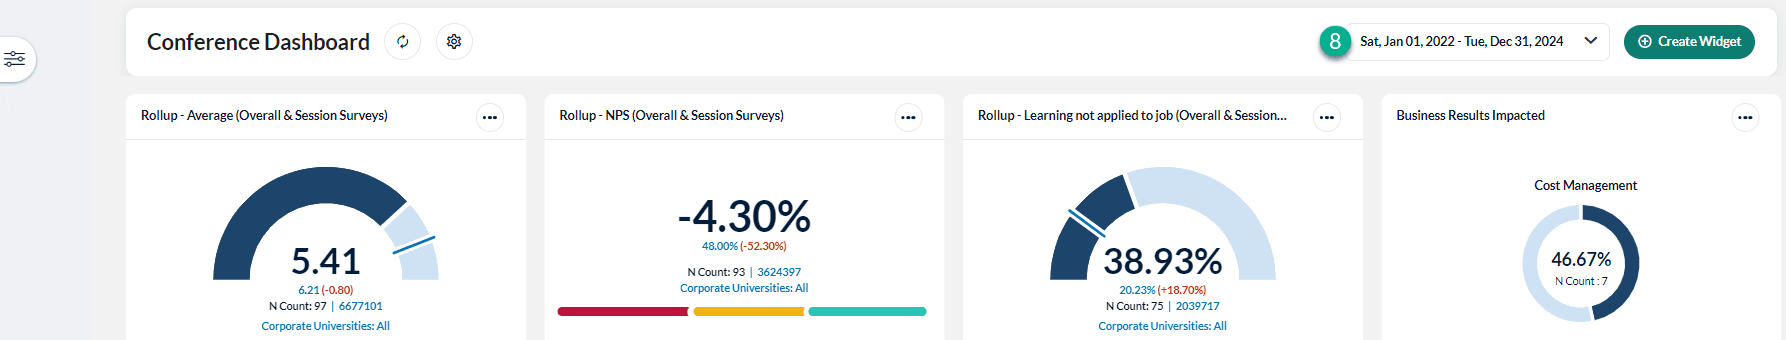
Roll Up (aggregate) scores
This section provides scores base on Average, NPS and Learning not applied to job (i.e. Scrap Learning) and include both the overall survey and the session surveys. Rolled Up scores show how your conference performed at the highest level and can be useful when comparing conferences to one another or during high level conversations.
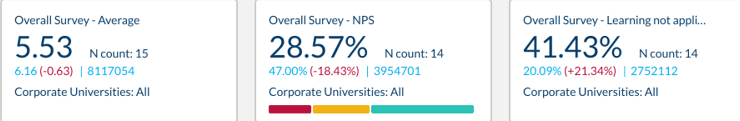
Overall Survey scores
This section provides scores base on Average, NPS and Learning not applied to job (i.e. Scrap Learning). Overall Surveys are generally completed after the program has ended and ask questions about the value of the entire program, not just individual sessions. These metrics can provide insights into:
- Why is the overall survey scoring different than the roll up average score (which includes the average score of the sessions)? Is there one particular session or sessions bringing the score down?
- Why is the overall NPS score for the overall survey so much higher than the roll up NPS score?
- Based on the Learning not applied to the job, is our training content aligned with the participants of this Blended Learning Program?
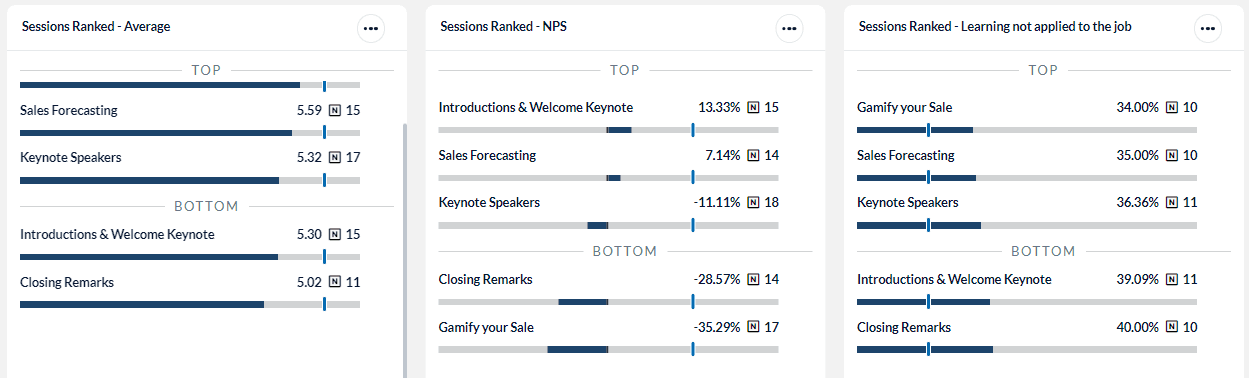
Session scores
This section provides scores base on Average, NPS and Learning not applied to job (i.e. Scrap Learning) based on the Top and Bottom ranked sessions. These metrics can provide insights into:
- Which sessions performed the best and which have the most opportunity for improvement?
- Which sessions are learners most and least likely to recommend to others?
- Which sessions did learners find most or least applicable to the job?
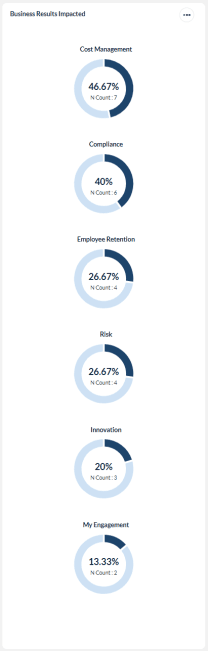
Business Results
This metric indicates which of your organization’s business objectives is being impacted by the Blended Learning Program.
- Determine which business outcomes learners predict will improve the most.
- Validate whether the Blended Learning Program is making an impact in the intended business areas.
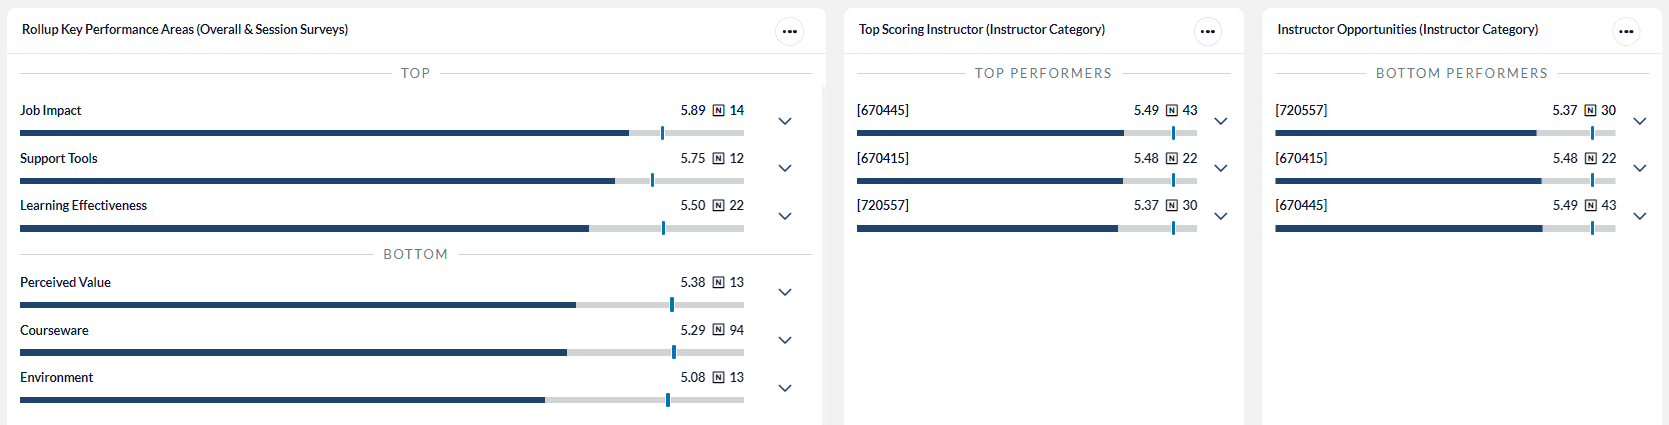
Key Performance Areas ranked
These metrics provide insights into the top and bottom question categories based on the rolled up performance scores from both the overall and session surveys.
- In which areas is our training strongest?
- Who are our top performing instructors?
- Which instructors need help to improve their training effectiveness?
Edit your Conference Dashboard
- Click on the Conference Dashboard
 icon to access the following options from the drop-down menu:
 - Select Dashboard Settings to modify or change the name of your dashboard.
- Select Export to create an image of your dashboard to use in presentations or share with colleagues. Once generated, a downloadable .png file will appear in your My Files under the Images tab.
- Select Share to allows others in your organization to use your Conference Dashboard as you have configured it. The shared users will not be able to change the configuration of your dashboard.
- Select Copy to create another version of this dashboard that you can modify and use in a different way.
- Select Delete to remove your dashboard from your My Dashboards screen.
- Select Refresh to update the data contained in your dashboard.
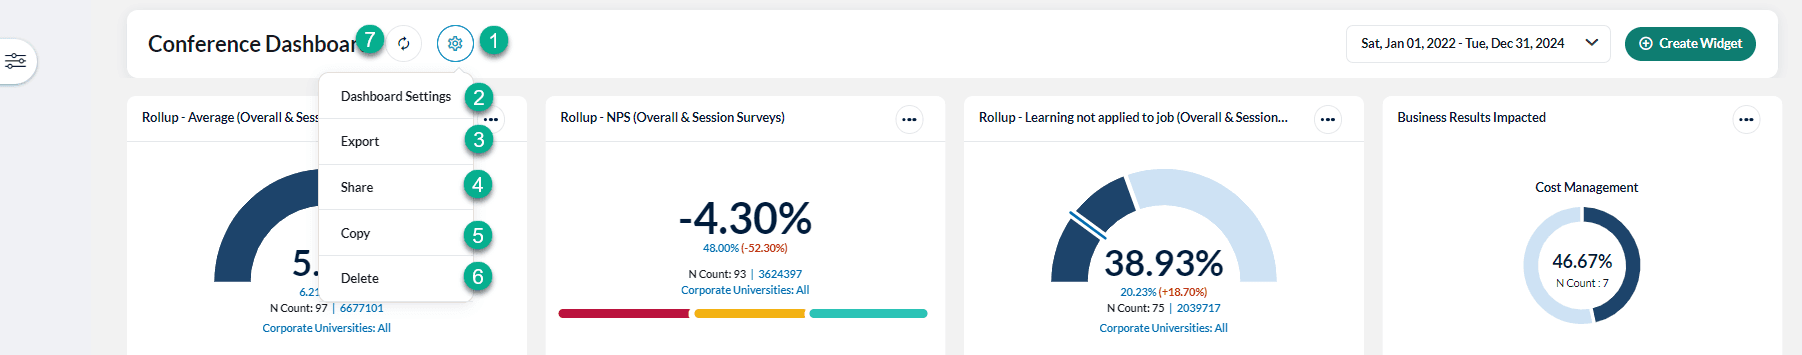
- Click on the Date Range field and select the period in which your program occurred.
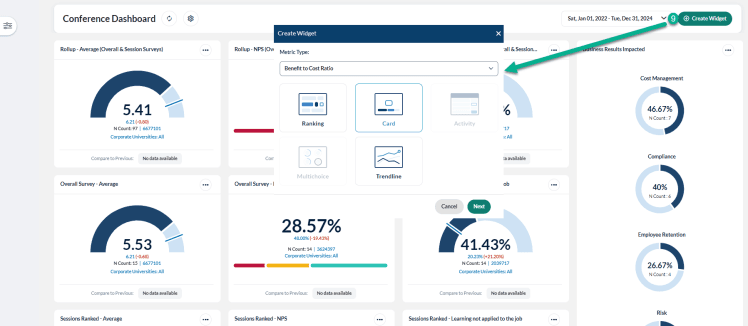
- Click on the create widget
 icon and select a metric type and display method.