Course Summary Report (Ready Report)
Overview
Introduction to the Course Summary Report
The Course Summary Report highlights key course, class, and instructor information for course owners to effectively manage their learning portfolio. This report allows you to quickly get insights into Key Metrics (NPS, Scrap, and Performance Improvement), highest and lowest performing courses, classes, and instructors during the selected time period, as well as areas of success and drivers behind any performance gaps. The Course Summary Report also provides optional Course Level Details, Event Level Details, and Instructor Level Details as an excel output, which provides question category level data, compared to a benchmark, for each course/class/instructor that collected data during the time frame of the report run. The Course / Event / Instructor Level Details also include Response Rate calculations for each course/class/instructor.
If you run your Course Summary Report for a period of one month or less, you can also include the Comment details in the excel output.
How can I use this report?
The Course Summary Report is designed to provide course owners with an overview of course performance, compared to a benchmark, to more easily understand where to focus improvement efforts. The Suggested Areas for Improvement provide insights into the areas that are most contributing to any performance issues. After reviewing the Course Summary, utilize the Course, Event, and Instructor Level Details outputs and/or log into MTM and use Data Explorer for further analysis and to pinpoint the root causes of any performance gaps. We would generally recommend scheduling this for automated delivery to individuals responsible for overall course performance (e.g. course owners, program managers, portfolio managers) on a monthly basis.
Who should use this report?
The Course Summary Report is designed for anyone who is responsible for overall course performance at your organization. These roles typically have titles like: Course Owner, Instructional Designer, Portfolio Manager, Learning Consultant, Curriculum Owner, etc.
Job aid
This following information will help you understand how to interpret and use the Course Summary Report.
What does this report include?
The Course Summary Report first provides an overview of performance for all courses that collected data during the selected date range and displays data configuration set of the report run.
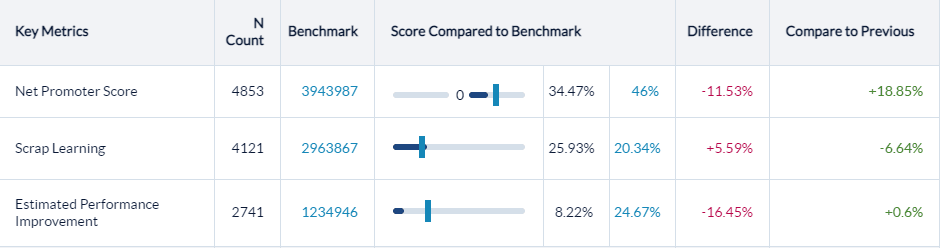
Key Metrics
Quickly get insights into Key Metrics (Net Promoter Score, Scrap Learning, and Estimated Performance Improvement) for all courses included in the date range you selected which indicate the health of your overall course portfolio. In addition, the Compare to Previous section will display the percentage change for the previous date range used in the report run (e.g. current quarter compared to last quarter).
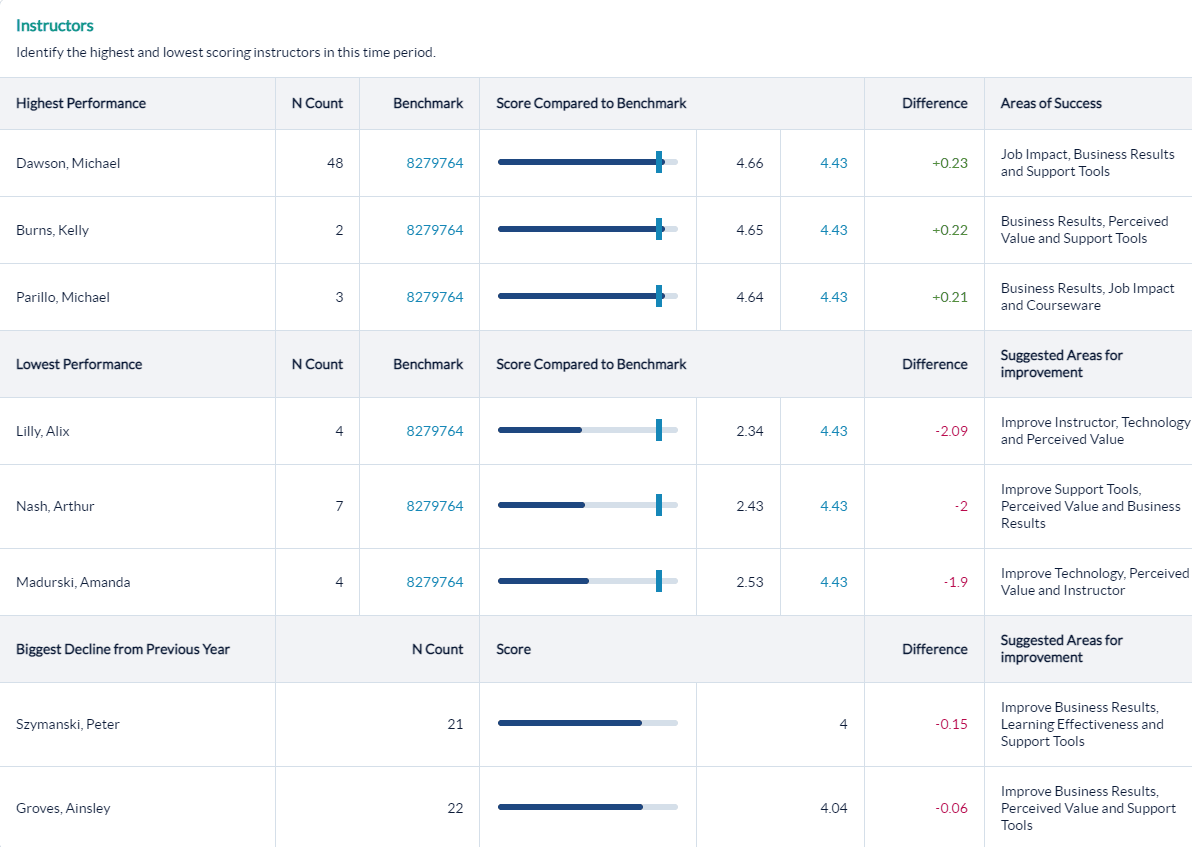
Highest and lowest performance
The top and bottom performing courses, as well as courses that had the largest decline in performance over the previous date range are highlighted. Next to each benchmark display are either Areas of Success (for highest performance) or Suggested Areas for Improvement (for lowest performance), which give insights into the drivers behind performance.
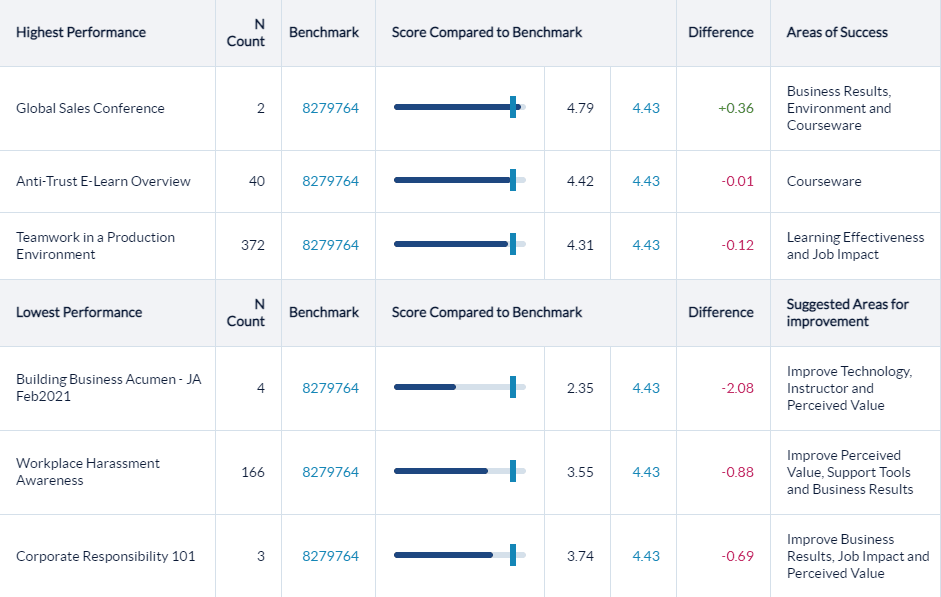
This report includes both course and conference (overall and session) data.
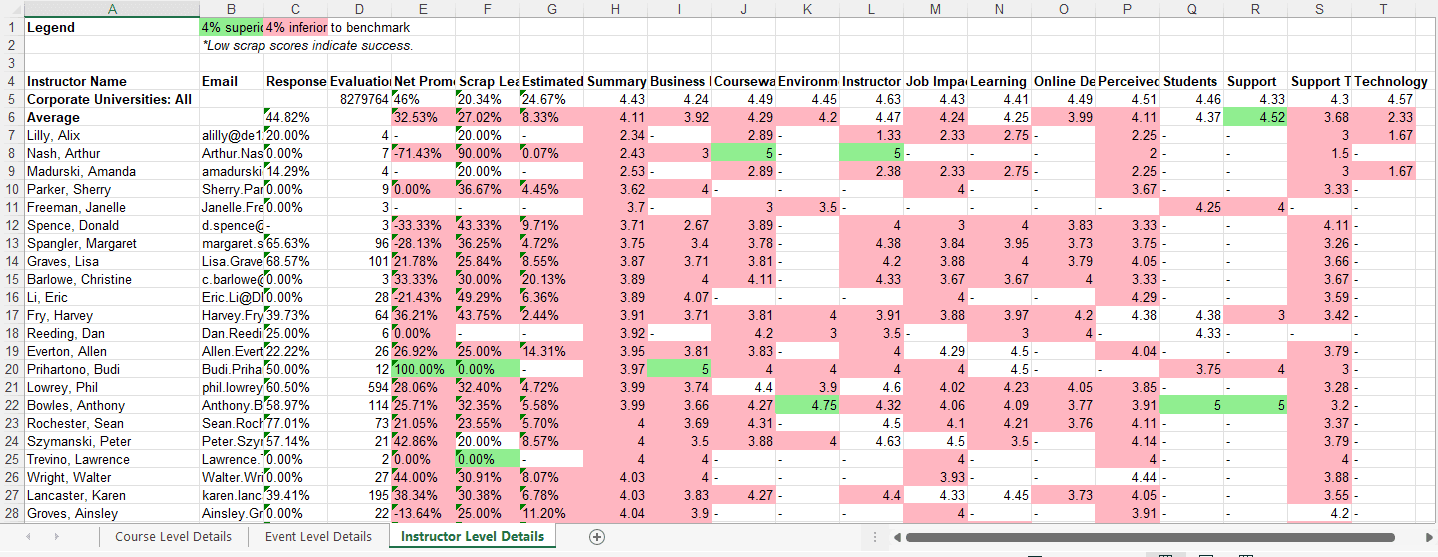
Optional course, event, and instructor level details
The Include Course, Event, and Instructor Level Details check boxes that appear in the Course Summary Query screen are optional outputs in the Course Summary Report, designed to provide more granular insights into areas that contribute to high or low performance. Use the three outputs to conduct further analysis into performance, including identifying areas for continuous improvement.
If you select to run any of these, you will be emailed a singular Excel file at the same time that the Course Summary Report generates. Depending on which Details report(s) you decided to run, the Excel file will contain 1-3 tabs, each tab displaying Course, Event, or Instructor Level Details. Note that the Excel file will also be stored in My Files.
The Details excel report displays a heat map, including Response Rate data, Key Metrics (NPS, Scrap, and Performance Improvement), and Question Category level performance color-coded against the benchmark. By default, data that falls 4% or more below benchmark will display in red; data that exceeds the benchmark by 4% or more will display in green; data that falls within 4% of the benchmark will not be color-coded. Note that when you run the Course Summary Report with Course/Event/Instructor Level Details, you have the option to modify the threshold that is used to calculate the difference from the benchmark. If you're using the threshold to monitor incremental improvements over time, note that it is possible to enter a negative threshold value; however, the negative score cannot be greater than the positive score.
Step-by-step instructions
Create and view Course Summary Reports
- Navigate to Reporting > Reporting.
- Select Ready Reports
- Click on the Course Summary icon.
Course Summary Query
- Expand the Course Summary Query section.
- Select a Date Range.
- Set the Minimum number of evaluations.
- Customize the Report Name to easily locate it for future use.
- [Optional] Click the check box beside one for these options to Include Course Level Details, Include Event (Class and Conference) Level Details, and/or Include Instructor Level Details (an Excel output will be sent to your email providing Response Rate, Key Metrics, and Question Category level performance compared to a benchmark data for each option).
- [Optional] Click the check box beside Include Comments (an Excel output will be sent to your email providing Course, Event, Instructor and Comments details for further analysis).
- You can also modify the settings of the color coding used to indicate % superior (green) or % inferior (red) to benchmark by changing the numeric values appearing beside each color.
BENCHMARK
- This report includes a Benchmark comparison based on your default Benchmark setting. To modify the Benchmark comparison for this instance of the report, expand the Benchmark section.
- Click Change.
- In the Benchmark Settings pop-up window, select a new Benchmark.
- Select Optional Benchmark Attributes for your report, if needed.
- Click Apply.
FILTER
- This report allows you to select filters that will narrow down the set of data that is included in your report. To add filters, expand the Filter section.
- Click Create New Filter
- In the Filters pop-up window, select a filter by clicking Add beside one of the options.
- A list of the options for that filter will be displayed. At the top of the pop-up window, enter a name for this filter in the Filter Name field.
- Click the check box beside each Filter option that you wish to use for your report.
- Click Apply
- Repeat the last 2 steps to add multiple Filters to your report, if needed. Be sure to click Apply after each selection to save your filter.
- Click Save. The new filters will appear in the Saved Filter list at the bottom of the screen, checked for use with this report.
A Single Use Filter allows you to filter the data of the report that you are currently preparing to run.
The Saved Filters are available for all reports throughout your MTM account.
- Click Run Report