Executive Summary Report (Ready Report)
Overview
Introduction to the Executive Summary Report
The Executive Summary Report is designed to provide insights into the impact and value of learning. The report provides key metrics collected from Post Event, Follow Up and Manager Surveys and provides recommendations for continuous improvement. You will find information about your learning programs’ results, including Business Results, Benefit to Cost Ratio (BCR), and Key Metrics like Net Promoter, Scrap Learning, and Estimated Performance Improvement. A benchmark comparison is also included for your BCR Key Metrics.
How can I use this report?
The Executive Summary Report is a high-level report designed for easy sharing of training results with business leaders within your organization. The report allows you to determine business results and impact for your learning programs as well as get an overall view into key metrics that business leaders care about. Using the data contained within the report, you and other members of your organization can identify successes as well as opportunities for improvement in your learning programs.
Who should use this report?
In general, the intended audience/consumer of the Executive Summary Report is your executive-level stakeholders or anyone who might be responsible for the overall performance of your learning function such as Learning Analysts, Learning Consultants, L&D Leaders. This report can be scheduled for automated delivery to your executive audience and/or you can download it to include more formalized stakeholder presentations. The Executive Summary Report is also ideal to provide a quick overview of learning’s impact on the business for a specific period of time to key stakeholders.
Job aid
This following information will help you understand how to interpret and use the Executive Summary Report.
What does this report include?
BUSINESS RESULTS
The first section of the Executive Summary Report provides insights into the Business Results impacted by training. These metrics indicate the level of alignment between business objectives and the learning experience. In the Predicted Results data set, the percentage of learners who indicated specific business results impact from training on the Post Event surveys will be displayed. In the Reported Results data set, the percentage of learners who indicated specific business results impact from training on the Follow Up surveys will be displayed.
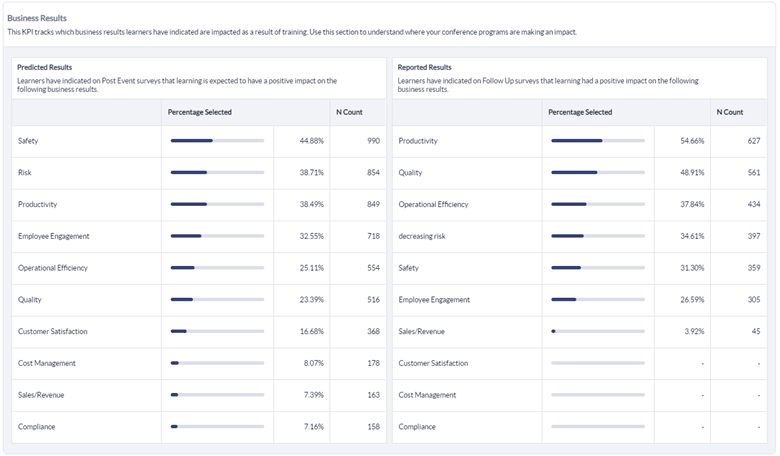
You can use this information to validate whether certain programs you deployed had the intended business results. For example, if you released a Leadership Development program, did you see the Employee Satisfaction increased as a result? Having a disconnect between the intended business objectives of a course or Portfolio of courses and the realized business results would indicate that further investigation or modifications to the audience or courseware might be warranted (note that other factors may also need to be considered). Keep in mind that the Executive Summary Report can be filtered to strategic courses, learning methodologies, etc. to hone in on business results achieved for those respective programs.
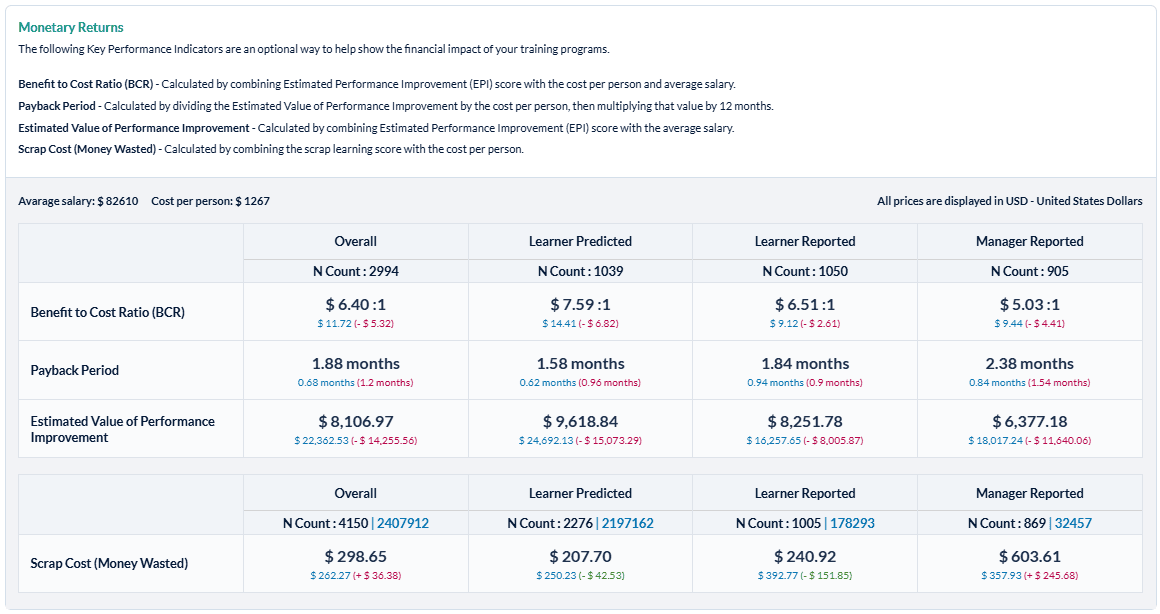
MONETARY RETURNS
The Monetary Returns section provides insights into the Benefit to Cost Ratio (BCR), Payback Period, Estimated Value of Performance Improvement, and Scrap Cost. These metrics show the financial impact of your training programs.
This section shows an estimation of each Monetary Return metric for you programs Predicted (Post Event) results, Reported (Follow-Up) results, and Manager Reported Results. The monetary values used to calculate the benefit to cost ratio can be customized when running the report. A low BCR would indicate the program cost more than the realized benefits. Take a look at the performance improvement metrics to determine where gaps might exist and use Data Explorer for root-cause analysis.
KEY METRICS
The Key Metrics section provides insights into Net Promoter, Scrap Learning, and Estimated Performance Improvement (PI) due to training. These three metrics are core leading indicators of learning effectiveness and impact specific to L&D. At a functional level, they are the critical indicators of L&D’s overall effectiveness and impact to the business.
Next to each Key Metric, a spark line shows the last 6 months’ worth of trending data for that particular metric. This spark line will not appear if the report is run with a custom date range. Net Promoter Score typically only appears on Post Event surveys. In this report, an overall Net Promoter score for the time period is included in the report. The Scrap Learning and PI metrics display Predicted, Reported, and Manager Reported data, allowing you to determine if there were any significant gaps between the impact learners expected to realize from training vs. the impact actually realized, in addition to the manager’s perspective.
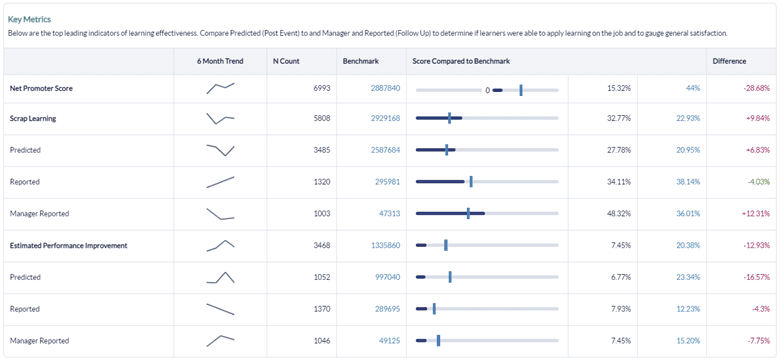
Use this information to determine if learners were able to apply learning on the job and to gauge general satisfaction with learning. Lower scores relative to benchmark or a significant gap between Predicted to Reported results would indicate lower L&D effectiveness and a need for additional root cause analysis. Use detailed reports and Data Explorer to dig deeper into your results.
REPORTING PORTFOLIO
If your organization is leveraging the Portfolio Model, this section will display results by Portfolio to determine how/if L&D drove value to the business in these areas. Lower performing Portfolios could indicate poor alignment between training programs and business results. Use the Portfolio filters in Ready Reports and Data Explorer to conduct further analysis.

The data will display time period/time period changes based on the overall average scores for that individual portfolio. For example, if you ran the report for last month’s worth of data, each Portfolio would display the overall average change from the previous month to last month (e.g. the change from March to April). If you ran the report for last year’s worth of data (e.g. 2021), you would see the overall change from the previous year to last year (e.g. the change from 2021 to 2020), based on average scores for that entire Portfolio of courses. This will allow you to gauge whether your individual measurement Portfolios are meeting expectations for performance and make adjustments where/if necessary.
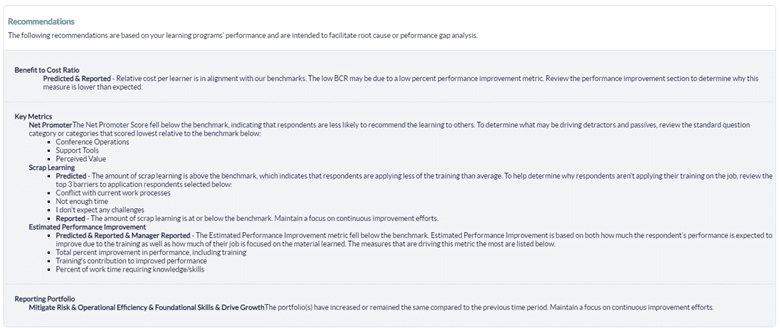
RECOMMENDATIONS
The Executive Summary Report provides targeted recommendations, based on your learning programs’ performance during the time frame used for the report run. These recommendations are intended to facilitate your analysis of any performance gaps by identifying why gaps might exist and where you should focus your root cause analysis efforts. Recommendations are provided for Benefit to Cost Ratio, Key Metrics (NPS, Scrap, PI), and Portfolio performance.
Your organization must be using standard MTM SmartSheet benchmarked questions as well as the Portfolio model to see and fully leverage these recommendations.
BENEFIT TO COST (BCR) RECOMMENDATIONS
The training isn't producing the expected benefit. Recommendations will display whether this is due to low performance improvement or related to training program cost or salary.
This metric measures training against expected benefit. If your BCR is low, recommendations indicate whether this is due to low performance improvement, training program’s cost, and/or salaries. MTM provides default values for the average learning program cost per learner of $1308 and an average salary per learner of $78130 which result in an average salary to cost ratio of 50:1. If the BCR falls more than 4% below benchmark, then MTM will analyze the cost.
- If your salary to cost ratio is greater than 50:1, this means that the learners are paid more than average, but the cost did not proportionately go up. In theory, this should yield a good return; since it’s not, the issue is that the performance improvement is lower than expected, so the recommendations will direct you to analyze your performance improvement metrics.
- If your salary to cost ratio is less than 50:1 and the cost is greater than the default of $1308, this means that your cost is higher than average, but salary is lower. In order to achieve a good Benefit to Cost Ratio, the performance improvement will need to be higher to justify the higher cost.
- If your salary to cost ratio is less than 50:1 and the cost is less than the default of $1308, this indicates that the cost (and potentially salary) are lower than typical. In this circumstance, we would recommend that expectations are set with stakeholders that, due to the types of roles going through training, the benefit to cost ratio may be slightly lower than benchmark.
We always recommend that you input your own organization’s average cost per learner as well as average salary in order to get a more accurate BCR calculation.
KEY METRICS RECOMMENDATIONS (NPS, SCRAP LEARNING, PI)
Net Promoter: Respondents aren't recommending the learning. If your NPS score is below benchmark, the Executive Summary Report will diagnose what is causing learner dissatisfaction and will display the question categories that fell the most below benchmark to indicate what might be contributing to a lower NPS.
Scrap Learning: Respondents aren't applying what they are learning. If your Scrap learning percentage is above the benchmark (meaning that learners aren’t applying as much of their learning as desired), the Executive Summary Report will diagnose the barriers to application and will display the top 3 identified barriers to focus on.
Performance Improvement: On-the-job performance improvement is low. If Estimated Performance Improvement (PI) is below benchmark, the Executive Summary Report will examine the three questions that feed into the PI calculation and then display whether the low PI score is because performance isn’t improving overall, because training isn’t causing an improvement or because the training doesn’t cover a significant part of the learners’ jobs.
REPORTING RECOMMENDATIONS
Reporting Portfolio: Performance has decreased from a previous reporting period. The Executive Summary Report will present the overall average score for all courses within a specific Portfolio and alert you to whether the scores are increasing, decreasing, or staying flat relative to the prior reporting time period. If there are Portfolios with decreasing performance, the Executive Summary Report logic determines which courses are most contributing to the decrease in performance and will display the bottom three courses as a starting point for further analysis and improvement efforts.
Step-by-step instructions
Create and view Executive Summary Reports
- Navigate to Reporting > Reporting.
- Select Ready Reports
- Click the title on the Executive Summary Report icon.
EXECUTIVE SUMMARY QUERY
- Expand the Executive Summary Query section.
- In Date Range, select the time frame that will be used to display the data used in your report from the drop-down date range menu. You can also select to use a Custom Date Range where you can set the Start Date and End Date fields.
- In Business Results, display result by the Top 3 or Show all Results.
Custom Business Results used in your surveys will also be included in Show all Results or if they are one of the Top 3.
- In Form Types, select the forms to include in your report from the drop-down form type menu. Post Event, Manager and Follow Up survey data will be included by default.
- The Currency, Average Cost Per Person and Average Salary Per Person feed into the Benefit to Cost Ratio calculation for the report.
- In Currency, use the default USD currency or select another one for your report from the drop-down currency menu.
- In Average Cost Per Person, use the default amount displayed or enter your own organization’s metric for this cost.
- In Average Salary Per Person, use the default amount displayed or enter your own organization’s metric for this cost.
- The currency default used is USD - United States Dollars. Another currency can be selected from the list in the drop-down currency menu.
- The Average Cost Per Person amount comes from the Association for Talent Development (ATD) research and the Average Salary Per Person figure comes from the US Department of Labor and Statistics. We recommend that you modify these amounts to correspond to your own organization’s metrics, if you have them. Putting in your own training programs cost per person and employee average salary will give you a more accurate Benefit to Cost calculation on the final report.
BENCHMARK
- This report includes a Benchmark comparison based on your default Benchmark setting. To modify the Benchmark comparison for this instance of the report, expand the Benchmark section.
- Click Change.
- In the Benchmark Settings pop-up window, select a new Benchmark.
- Select Optional Benchmark Attributes for your report, if needed.
- Click Apply.
FILTER
- This report allows you to select filters that will narrow down the set of data that is included in your report. To add filters, expand the Filter section.
- Click Create New Filter
- In the Filters pop-up window, select a filter by clicking Add beside one of the options.
- A list of the options for that filter will be displayed. At the top of the pop-up window, enter a name for this filter in the Filter Name field.
- Click the check box beside each Filter option that you wish to use for your report.
- Click Apply
- Repeat the last 2 steps to add multiple Filters to your report, if needed. Be sure to click Apply after each selection to save your filter.
- Click Save. The new filters will appear in the Saved Filter list at the bottom of the screen, checked for use with this report.
A Single Use Filter allows you to filter the data of the report that you are currently preparing to run.
The Saved Filters are available for all reports throughout your MTM account.
- Once you have made all of your report selections, click Run Report.
Schedule and distribute Executive Summary Reports
This report can be shared with your executive level stakeholders, learning leaders and anyone else responsible for the overall performance of your learning function. This report can be scheduled for automated delivery or downloaded using the Export function for more formal presentations.
- Run the Executive Summary Report (see above for instructions)
- Click on the
 icon to select Schedule from the drop-down actions menu at the top right of this report,
 - or navigate to the Report Queue at the top of the screen, click the
 icon in the Actions column next to your report, and select Schedule from the drop-down menu.
 - Configure the Query Date Range by selecting a date range from the drop-down date range menu.
- Select the Frequency of the Report Delivery from the drop-down report delivery menu.
- Select what day the report will be Sent On based on your selections above.
- Select to whom you want to automatically send this report.
- Click the Me checkbox to send the report to yourself.
- Enter email addresses separated by semi colons to sent the report to others.
- Select Course Report Recipients if all (select all) or specific individuals (select from the down-down menu) should receive the reports.
Course Report Recipients are assigned to specific courses and must be first set up by your MTM Administrator. They will only receive this report when a class or event contains a course assigned to them.
- Modify the Subject title if you wish.
- Customize the Body message by creating a message that explains why you are sending this report and what the users should do with it.
- Select Include DE link to include a direct link in the email message that allows individuals to further analyze the data contained in the report using Data Explorer.
To access Data Explorer, the individuals must have a Reporting user license that includes Data Explorer.
- Select Add Image to make your emails more visually appealing and aligned with your own organization’s brand by adding an image or logo to your email.
- From the pop-up window, Select or search for an existing image or logo from the Library
- Or click on the Upload tab,
- Then click on Browse to locate the image on your computer, network or shared drive.
- Enter an Image Name.
- Click Upload.
- To complete the set up of your report, select Update.
Manage Scheduled Executive Summary Reports
- Navigate to Ready Reports and select the Scheduled Reports tab.
- Locate the report you wish to modify and click on the icon in the Action column. A drop-down list will appear allowing you to:
- Audit your report.
- View the Report Delivery History.
- Edit your report.
- Delete your report.