Instructor Performance Report (Ready Reports)
Overview
Introduction to the Instructor Performance Report
The Instructor Performance Report is designed to give instructors and their managers insight into instructor performance over a selected period of time. The Instructor Performance Report has three outputs:
- Instructor Performance by Course (individual Instructor report)
- Instructor Performance by Event (includes classes, an overall conference, and conference sessions) (individual Instructor report)
- Instructor Performance Summary (summary of performance for selected instructors)
Using the various outputs, instructors and their managers can determine areas of success as well as opportunities for improvement.
The Instructor Manager version of the Instructor Performance Report will NOT run unless instructor managers are configured in MTM for your organization. Additionally, only MTM Super Admin users can run the Instructor Manager output of the Instructor Performance Report.
How can I use this report?
Instructors and instructor managers can leverage the Course and Events outputs of the Instructor Performance Report to gain insights into individual instructors' performance, compared to a benchmark, over a selected period of time. The Summary output of the Instructor Performance Report is intended for instructor managers to be able to monitor all of their instructors' performance on a periodic basis.
Instructors and their managers can easily identify areas of strength as well as opportunities for improvement and set development plans accordingly. After reviewing Instructor Performance, MTM Admin or Reporting users can log into MTM and use Data Explorer for further analysis to pinpoint the root causes of any performance gaps. We would generally recommend scheduling this report for automated delivery to Instructor Managers on a monthly, quarterly and/or annual basis.
The Instructor Performance Report is automatically filtered to only include Post Event data. Also note that the benchmark is filtered to Post Event data, as well.
Who should use this report?
Instructors, Instructor Managers or other individuals responsible for monitoring and managing training delivery.
Job Aids
Instructor Performance Report (by Class)
This section will help you understand how to interpret and use the Instructor Performance Report, run by Class.
This report supports both class and conference (overall and session) data. The report as well as the benchmark are automatically filtered to only include Post Event data.
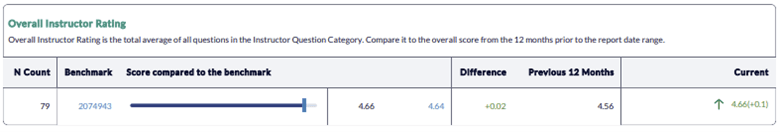
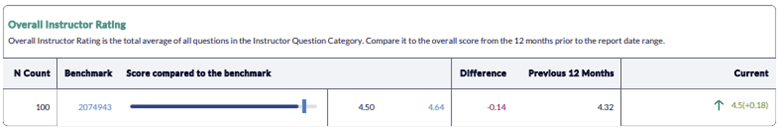
Overall Instructor Rating
View the Instructor's overall score in the Instructor Question Category, compared to the selected benchmark, for the reported time period, plus a comparison for the previous 12 months, based on the reporting start date. Use this data to gauge whether the Instructor's performance has increased, decreased, or stayed flat, and set development goals accordingly.
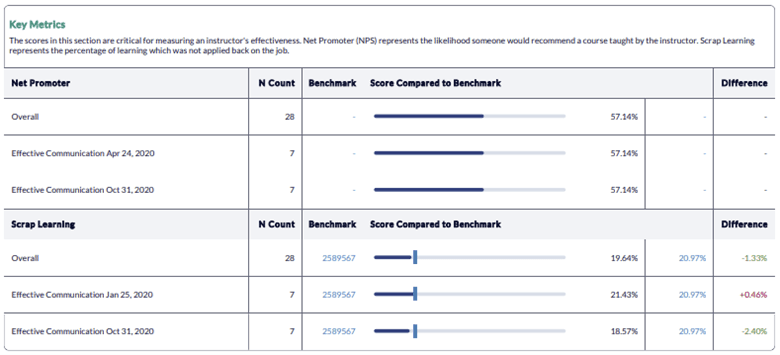
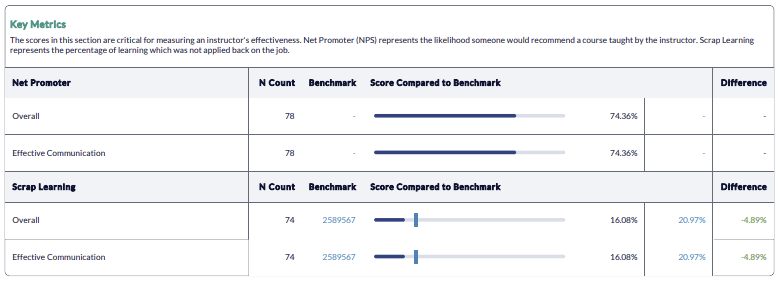
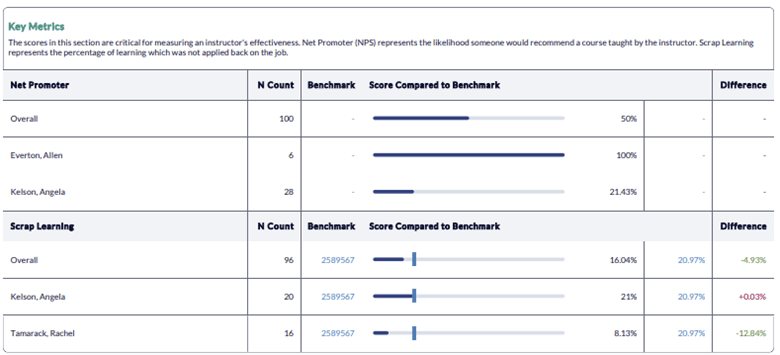
Key Metrics
View Net Promoter Score (NPS) and Scrap Learning scores for this Instructor. Results will include overall scores, plus top and bottom performing classes for each metric. Instructors can influence both learners' perception of the value of training (as indicated by the NPS score) as well as the amount of learning that's applied on the job (as indicated by Scrap). If you have low NPS or high Scrap scores, focus heavily on connecting the new knowledge and skills with the daily professional lives of the learners.
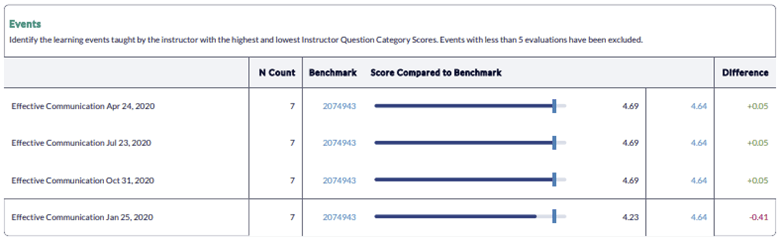
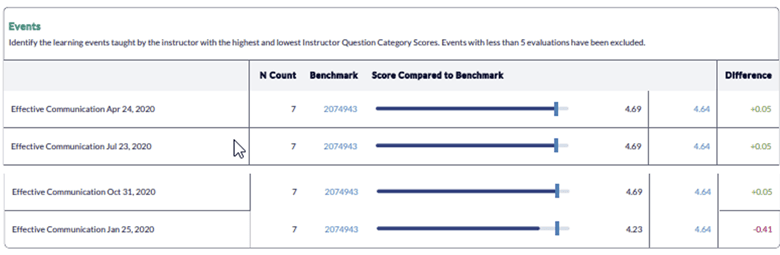
Events
Easily identify top 3/bottom 3 performing classes (formal learning), overall conferences and conference sessions for this time period, filtered to the Instructor Question Category.
If fewer than 6 classes were taught during this time period, events will display ranked from highest performing to lowest performing
Focus improvement efforts on any lower scoring classes. Run a Quick Question Report or utilize Data Explorer to determine the cause of lower scores and set action plans for improvement accordingly.
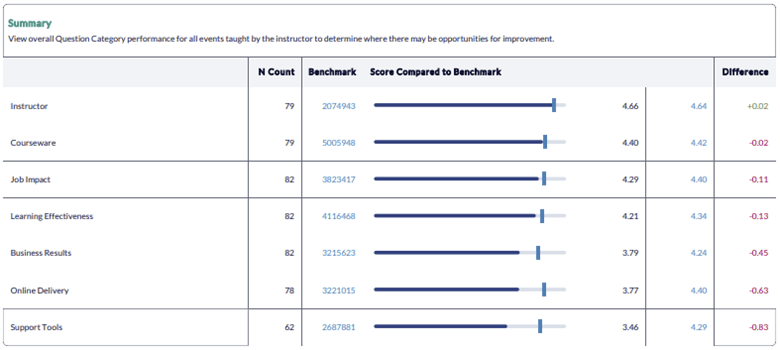
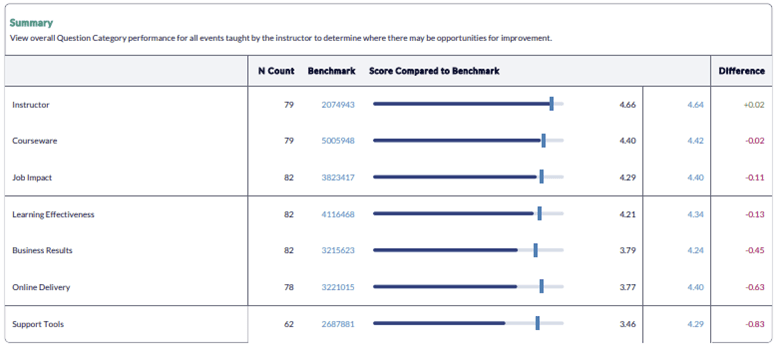
Summary
View performance across all question categories for this Instructor for all classes taught during this time period. Use this information to determine where there may be opportunities for improvement. Although the Instructor may not have direct control over some of these areas, s/he can nevertheless influence performance by ensuring learners are engaged and understand how to apply learning on the job.
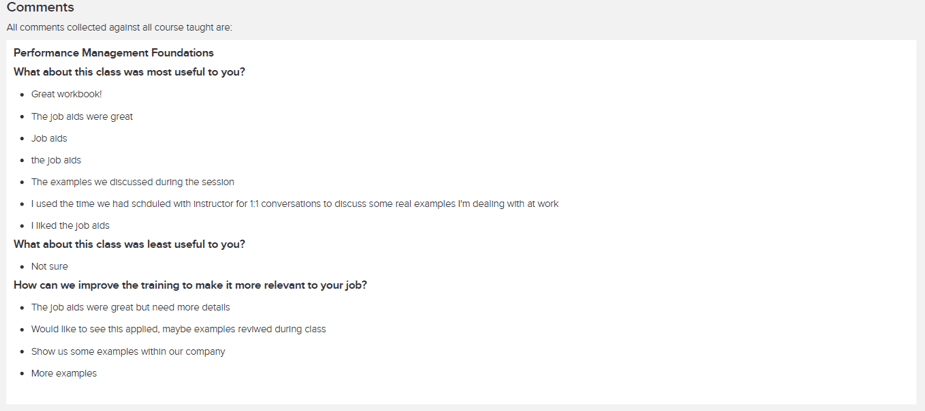
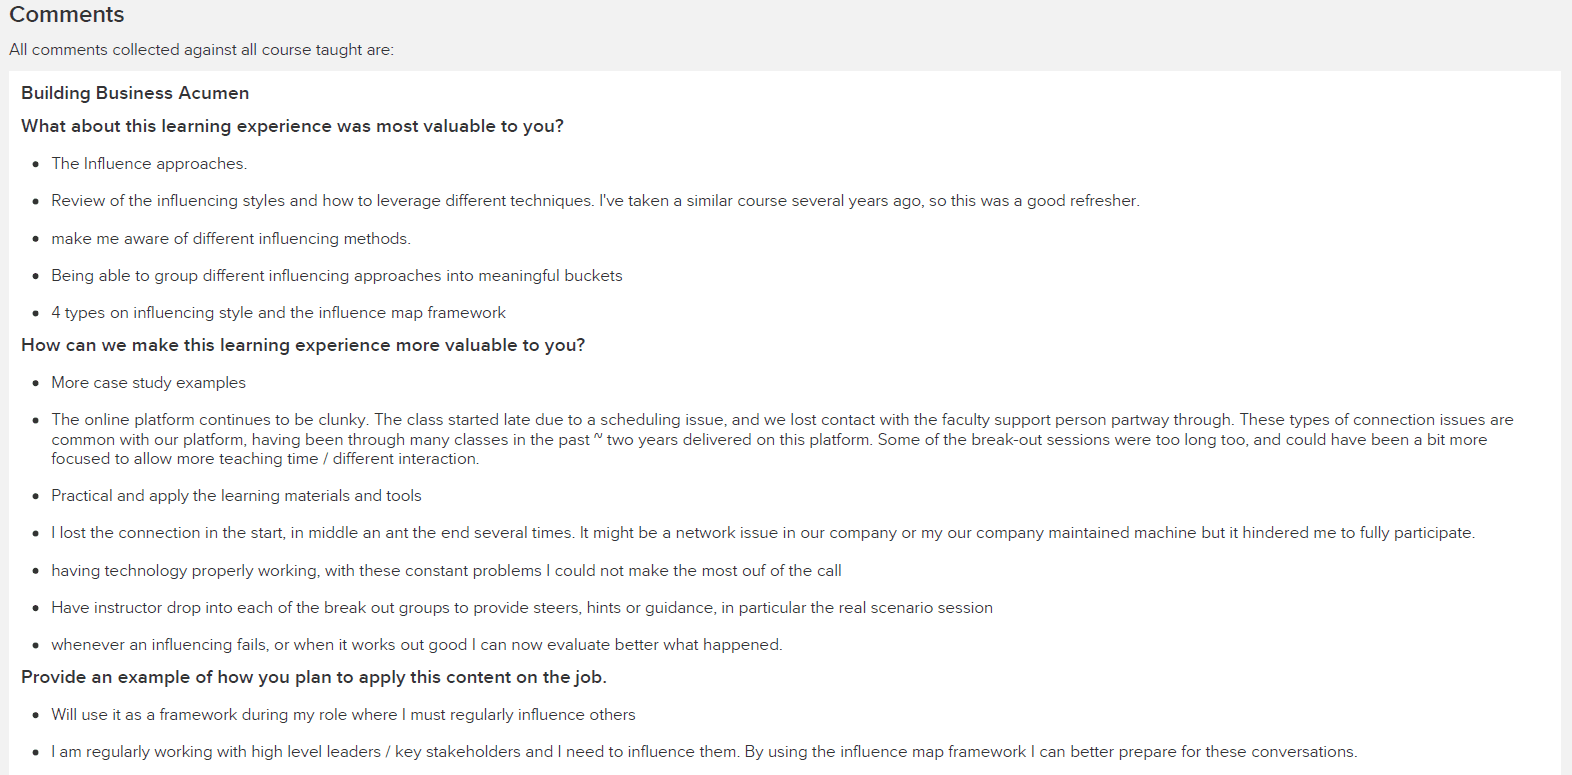
Comments
Analyze your Learner Comments to get first-hand information from learners about what to maintain and what to improve. Use the comments to highlight wins and drive continuous improvement. Examples of how learners plan to apply the training can be shared with future classes to help students connect the training with their job performance. Note that Learner Comments can only be included on reports run with a date range of one month or less.
Instructor Performance Report (by Course)
This article will help you understand how to interpret and use the Instructor Performance Report, run by Class.
This report supports both class and conference (overall and session) data. The report as well as the benchmark are automatically filtered to only include Post Event data.
Overall Instructor Rating
View Instructor's overall score in the Instructor Question Category, compared to the selected benchmark, for the reported time period, plus a comparison for the previous 12 months, based on the reporting start date. Use this data to gauge whether this Instructor's performance has increased, decreased, or stayed flat, and set development goals accordingly.

Key Metrics
View Net Promoter Score (NPS) and Scrap Learning scores for this Instructor. Results will include overall scores, plus top and bottom performing courses for each metric. Instructors can influence both learners' perception of the value of training (as indicated by the NPS score) as well as the amount of learning that's applied on the job (as indicated by Scrap). If you have low NPS or high Scrap scores, focus heavily on connecting the new knowledge and skills with the daily professional lives of the learners.
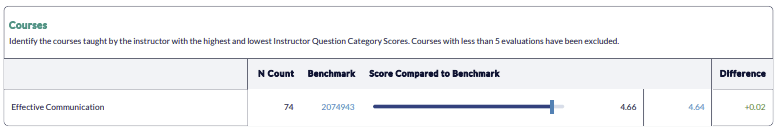
Courses
Easily identify top 3/bottom 3 performing courses for this time period, filtered to the Instructor Question Category (note that if fewer than 6 courses were taught during this time period, courses will display ranked from highest performing to lowest performing). Focus improvement efforts on any lower scoring courses. An aggregate Quick Question Report (filtered to low scoring course), Data Explorer, or the Course Summary Report can be used to identify areas of improvement.
Classes
Easily identify top 3 bottom 3 performing classes, filtered to the Instructor Question Category (note that if fewer than 6 classes were taught during this time period, classes will display ranked from highest performing to lowest performing). Focus improvement efforts on any lower scoring classes. Run a Quick Question Report or utilize Data Explorer to determine the cause of lower scores and set action plans for improvement accordingly.
Summary
View performance across all question categories for this Instructor for all courses taught during this time period. Use this information to determine where there may be opportunities for improvement. Although the Instructor may not have direct control over some of these areas, s/he can nevertheless influence performance by ensuring learners are engaged and understand how to apply learning on the job.
Comments
Analyze your Learner Comments to get first-hand information from learners about what to maintain and what to improve. Use the comments to highlight wins and drive continuous improvement. Examples of how learners plan to apply the training can be shared with future classes to help students connect the training with their job performance. Note that Learner Comments can only be included on reports run with a date range of one month or less.
Instructor Performance Report (by Summary)
This article will help you understand how to interpret and use the Instructor Performance Report, run by Summary. You can easily print this job aid by clicking the Print icon at the top right of the article.
This report supports both class and conference (overall and session) data. The report as well as the benchmark are automatically filtered to only include Post Event data.
Overall Instructor Rating
View overall score in the Instructor Question Category, compared to the benchmark, for the reported time period for all Instructors included in the report query, plus a comparison for the previous 12 months, based on the reporting start date. Use this data to gauge whether Instructors' performance has increased, decreased, or stayed flat, and set development goals accordingly.
Key Metrics
View Net Promoter Score (NPS) and Scrap Learning scores for all instructors included in the report query. Results will include overall scores, plus the top and bottom performing Instructor for each metrics. Instructors can influence both learners' perception of the value of training (as indicated by the NPS score) as well as the amount of learning that's applied on the job (as indicated by Scrap). If Instructors have low NPS or high Scrap scores, they should focus heavily on connecting the new knowledge and skills with the daily professional lives of the learners.
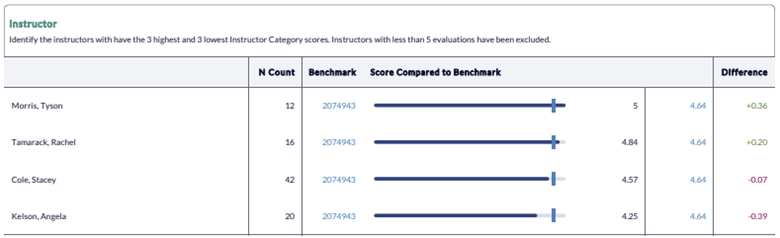
Instructor
Easily identify the top 3/bottom 3 performing Instructors, filtered to the Instructor Question Category. Focus improvement efforts on any lower scoring Instructors. Analyze your individual Instructor Performance Reports and utilize Data Explorer to dig deeper into areas of improvement for lower performing Instructors.
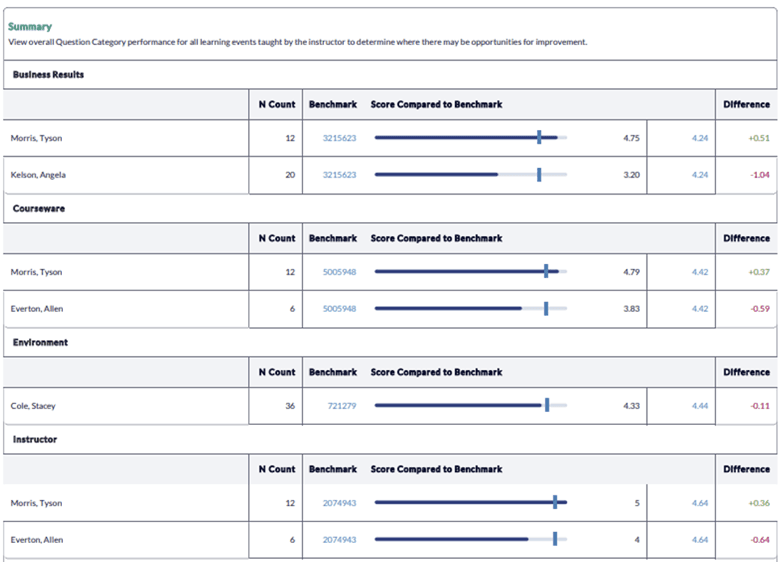
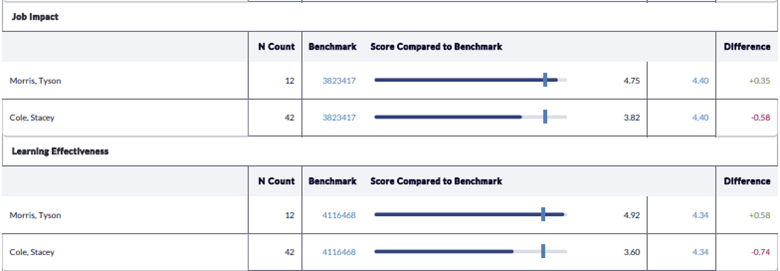
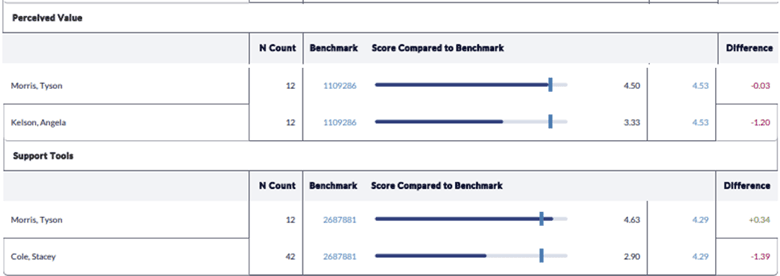
Summary
View top and bottom performing Instructor for each Question Category on your surveys, compared to a benchmark. Analyze your individual Instructor Summary Reports and utilize Data Explorer to dig deeper into areas of improvement for lower performing Instructors and Question Categories. Instructors that consistently score low across all Question Categories may be in need of additional development. Although Instructors may not have direct control over some of these areas, they can nevertheless influence performance by ensuring learners are engaged and understand how to apply learning on the job.
Step-by-step instructions
Create and view the Instructor Performance Report (Instructor Query)
- Navigate to Reporting > Reporting.
- Select Ready Reports
- Click on the Instructor Performance Report icon.
INSTRUCTOR PERFORMANCE REPORT
- Expand the Instructor Performance Report section.
- For Query Type, select Instructor Query.
- Select your Date Range.
- Click Search and Select Instructors to display a list of instructors who have taught classes within the selected date range in a pop-up window.
- Click the checkbox next to each Instructor you wish to include in your report.
- Click Close. Your selections will be displayed in the Selected Instructor field.
If specific instructor(s) do not appear in your list, they have not taught a class(es) within the date range selected. To display those instructors, use a wider date range.
- In the Report by field drop-down menu, select to report by Course or by Event (Class or Conference).
- Modify your Minimum N Count, if needed.
- Customize the Report Name to easily locate it for future use.
- In the Report Type field, both Individual Report(s) and Summary are selected by default. You can deselect either of these choices if not needed for this report.
The Summary Report includes individual instructor performance data and should only be sent to those who should have access to view this data.
- Select Include Comments to provide your instructors with additional Course or Event data that can help provide more insights into the results displayed in the report.
Comments can only be included if the date range is a month or less.
- Click Send Individual Report to Instructors to send a report to each instructor.
Instructors who taught classes during the date range selected will receive a Course or Event (Class or Conference) report emailed to them containing their own data.
- Enter email addresses separated by semi colons (;) in the Send Email Notification to field of additional individuals who should also receive this report.
- Click Email Settings to customize the email message used to send these reports.
- In the Email settings pop-up window, select the Instructor or Summary tab to customize the contents each of the email types.
- By default, the Subject field provides the Report Name. This field can be modified by entering additional text.
- In addition, a Select a Tag drop-down menu is available for the Instructor Email Settings to provide access to tags which customize the subject line by adding the Instructor Name and Report Name Click the radio button beside your selection(s) and click Add. If no customization is needed, click None.
- Modify the email text that will accompany each report by communicating to the report users why they are receiving this report and what you expect them to do with the information contained within the report. You can use the HTML editor to customize the look and feel of the text as well as add links to content outside MTM.
- Click Save Email.
BENCHMARK
- This report includes a Benchmark comparison based on your default Benchmark setting. To modify the Benchmark comparison for this instance of the report, expand the Benchmark section.
- Click Change.
- In the Benchmark Settings pop-up window, select a new Benchmark.
- Select Optional Benchmark Attributes for your report, if needed.
- Click Apply.
FILTER
- This report allows you to select filters that will narrow down the set of data that is included in your report. To add filters, expand the Filter section.
- Click Create New Filter
- In the Filters pop-up window, select a filter by clicking Add beside one of the options.
- A list of the options for that filter will be displayed. At the top of the pop-up window, enter a name for this filter in the Filter Name field.
- Click the check box beside each Filter option that you wish to use for your report.
- Click Apply
- Repeat the last 2 steps to add multiple Filters to your report, if needed. Be sure to click Apply after each selection to save your filter.
- Click Save. The new filters will appear in the Saved Filter list at the bottom of the screen, checked for use with this report.
A Single Use Filter allows you to filter the data of the report that you are currently preparing to run.
The Saved Filters are available for all reports throughout your MTM account.
The Instructor Manager version of the Instructor Performance Report will NOT run unless Instructor Managers have been configured in MTM for your organization. Additionally, only MTM Super Admin users can run the Instructor Manager output of the Instructor Performance Report.
- Navigate to Reporting > Reporting.
- Select Ready Reports
- Click on the Instructor Performance Report icon.
INSTRUCTOR PERFORMANCE REPORT
- For Query Type, select Instructor Manager Query.
- Select your Date Range
- In the Report by field, select to report by either Course or Event (Class and Conference).
- Modify your Minimum N Count, if needed.
- Customize the Report Name to easily locate it for future use.
- In the Report Type field, you can select to run the report as Individual Report(s), a Summary or both .
- Select Include Comments to provide your instructor Managers with additional Course or Event data that can help provide more insights into the results displayed in the report.
Comments can only be included if the date range is a month or less.
- Click Send Individual Reports to Instructor Managers if this report should be emailed to the managers.
- The Instructor Manager will receive a report for each of their instructors (if selected), plus a Summary report if the Include Summary option is selected.
- If Instructor Manager Filter is not applied: All Instructor Managers will receive reports.
- If Instructor Manager filter is applied: Only the Instructor Manager(s) included in the filter will receive reports.
- If only the Include Summary is selected: One summary report containing data for all Instructors assigned to that Instructor Manager will be sent.
- In the Send Email Notification to field, enter the email address(es) of other individual(s) who should receive this report.
This field is limited to 500 characters and email addresses should be separated by semi colon(s).
- Click Email Settings to customize the email message used to send these reports.
- In the Email settings pop-up window, select the Instructor or Summary tab to customize the contents each of the email types.
- By default, the Subject field provides the Report Name. This field can be modified by entering additional text.
- In addition, a Select a Tag drop-down menu is available for the Instructor Email Settings to provide access to tags which customize the subject line by adding the Instructor Name and Report Name Click the radio button beside your selection(s) and click Add. If no customization is needed, click None.
- Modify the email text that will accompany each report by communicating to the report users why they are receiving this report and what you expect them to do with the information contained within the report. You can use the HTML editor to customize the look and feel of the text as well as add links to content outside MTM.
- Click Save Email.
BENCHMARK
- This report includes a Benchmark comparison based on your default Benchmark setting. To modify the Benchmark comparison for this instance of the report, expand the Benchmark section.
- Click Change.
- In the Benchmark Settings pop-up window, select a new Benchmark.
- Select Optional Benchmark Attributes for your report, if needed.
- Click Apply.
FILTER
- This report allows you to select filters that will narrow down the set of data that is included in your report. To add filters, expand the Filter section.
- Click Create New Filter
- In the Filters pop-up window, select a filter by clicking Add beside one of the options.
- A list of the options for that filter will be displayed. At the top of the pop-up window, enter a name for this filter in the Filter Name field.
- Click the check box beside each Filter option that you wish to use for your report.
- Click Apply
- Repeat the last 2 steps to add multiple Filters to your report, if needed. Be sure to click Apply after each selection to save your filter.
- Click Save. The new filters will appear in the Saved Filter list at the bottom of the screen, checked for use with this report.
A Single Use Filter allows you to filter the data of the report that you are currently preparing to run.
The Saved Filters are available for all reports throughout your MTM account.
If you wish to only send the summary report to specific Instructor Manager(s), you must apply an Instructor Manager filter in the Filter section.
- Click Run Report.
Schedule and distribute Instructor Performance Reports
- Run the Instructor Performance Report using the Instructor Query (Instructions are provided above).
- Locate your report in Queued Reports.
- Click the
 in the Actions column beside your report.
 - Select Schedule from the drop-down menu.
- In the Scheduled Report Name field, customize your report name.
- Select a Query Date Range
a. Dynamic Dates - your report query will be based on the predefined range selected from the drop-down menu. This is the most commonly used selection.
b. Original Dates - your report query will be based on the original date range you used to generate your report. - This would make your scheduled report a static report. - Select the Frequency of Report Delivery from the drop-down menu.
- Select the End Frequency to determine how long your report will be automated, or how many reports you'll receive. Once the occurrence is over, you will stop receiving reports and will need to reschedule this report to continue receiving it.
- Select the date First Report Delivered On which represents the date the automated reports will begin. If you backdate a report, you will receive every instance of that report that would have previously been generated.
- Send reports to:
a. Me - Send the automated report to yourself.
By selecting this option, the report will be sent to the email associated with the account you are logged into. However, if you are impersonating another user, the report will be sent to that user's email.
b. Instructor Managers - Send the report to the individual Course Report Recipients (CRR) who should receive this report. c. Other Recipient(s) - Enter the email addresses of each recipient, separated with a semicolon ( ; ).
Instructors email
- Subject - By default, the Report Name and the Instructor Name with be displayed. Remove these tags directly from the field, or reselect them from the drop-down menu and clicking Add.
- Body - We recommend you include a brief description of the report about why these individuals are receiving this report and what you expect them to do with the data.
- Click Add Image to upload a logo or image to customize the email message.
- Click the checkbox beside Include DE link to include a direct link to Data Explorer to allow the individual to further analysis the data received in the report.
To access Data Explorer via the link in this email, users must have a license which allows them access to reporting in MTM.
Summary Email
- Subject - By default, the Report Name will be displayed.
- Body - We recommend you include a brief description of the report about why these individuals are receiving this report and what you expect them to do with the data.
- Click Add Image to upload a logo or image to email message.
All reports will be delivered in PDF format.
- Click Update.
You will only be able to schedule the Summary output of the Instructor Performance Report if the report was generated to include the Summary view.