Program Performance Report (Ready Report)
Overview
Introduction to the Program Performance Report
The Program Performance Report gives users an overview of a blended learning program for its program level survey and session surveys. It is helpful for analyzing and comparing program level and session performance to answer questions such as:
- Did the training provided at this program have the expected business impact?
- What barriers to applying this new knowledge did the participants disclose?
- Was the content appropriate for the participants who attended?
- Which sessions were not highly recommended, and what could be done to improve or replace them for our next program?
- How well were the presenters received, and how will those results influence the selection of presenters at future programs?
How can I use this report?
This report can be used to identify and share high and low performing key metrics and question categories to identify successes as well as areas of improvement for future Blended Learning Programs. This report also contains individual question and instructor performance and can be run for a single program, like a class-based report.
Who should use this report?
Anyone who is responsible for analyzing training impact and driving continuous improvement of your program programs can benefit from the Program Performance Report. This report can be scheduled for automated delivery.
The Program Performance Report is designed to generate a report for a single program. To compare multiple programs, use the Data Explorer tool. Click here for more information about Data Explorer.
Job aid
This following information will help you understand how to interpret and use the Program Performance Report.
What does this report include?
The Program Performance Report contains two sections:
- The first section of the report provides Program level data.
- The second section of the report breaks down performance at the individual session level.
What topics are covered in the Program Level Surveys section?
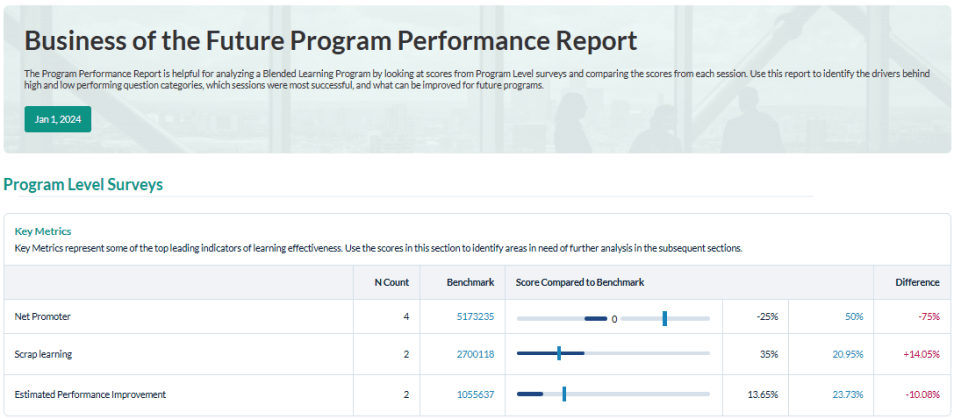
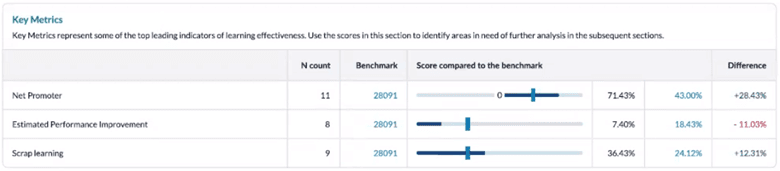
Key Metrics
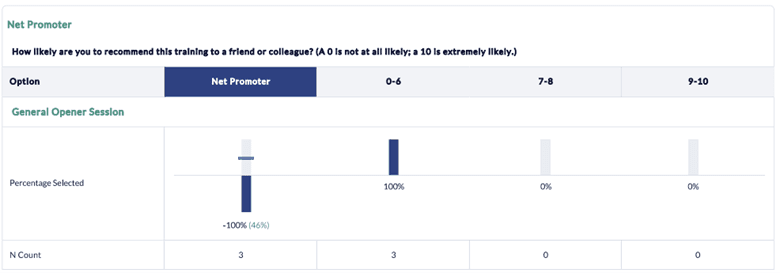
The Key Metrics section provides insights into Net Promoter Score, Estimated Performance Improvement due to training and Scrap Learning related to the Blended Learning Program. These three metrics are core leading indicators of learning effectiveness and show impact specific to Learning & Development (L&D) at a functional level.
These metrics display:
- an N count, which represents the number of surveys collected within your organization that contain the question categories relevant to your program level and session surveys.
- the Benchmark, which is the number of surveys in the benchmark group that you selected for this report that also contain the question categories relevant to your program level survey and session surveys.
- a bar graph that illustrates your program score compared to the Benchmark, followed by the benchmark percentage score in light blue; your program percentage score in dark blue; and, to the far right, a column indicating the difference between the benchmark percentage score and your program percentage score. Positive results against the benchmark will display in green; negative results against the benchmark will display in red.
You can use the information in the Key Metrics section to validate whether learning provided at the program level is having the desired impact and whether program participants were able to effectively apply that learning on the job. If the data reveals significant gaps, further analysis may be warranted to determine the root cause and to establish action plans moving forward for performance improvement. Data Explorer is the ideal tool for this type of analysis. Click here to learn more about Data Explorer.
Business Results
This section provides additional insights into the business results impacted by training. These metrics indicate the level of alignment between business objectives and the learning experience. The post event data set shows the percentage of participants who indicated specific business results which impacted training on the post event survey. The follow up data set provides the percentage of participants who indicated specific business results which impacted training on the follow-up survey. Your business results can be customized on the conference surveys based on the specific business objectives the Blended Learning Program is intended to impact.
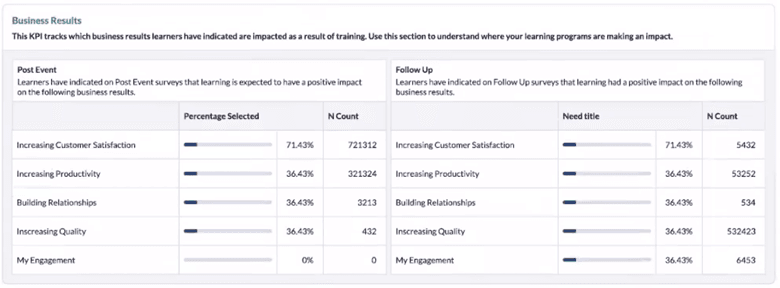
You can use this information to validate whether a certain blended learning program had the intended business results.
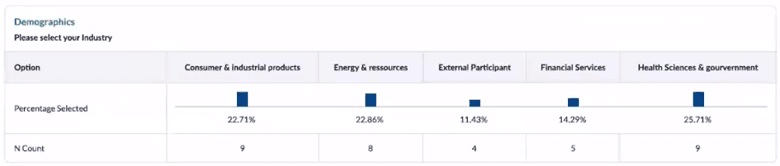
Demographics
This section provides a percentage breakdown and N count of the participants who attended the blended learning program based on specific demographic options that were uploaded with the participant data into MTM or entered by the participants before completing their surveys. This data can be helpful in your overall assessment of the program as you try to determine whether the activities and information provided were well aligned with your various demographic audiences.
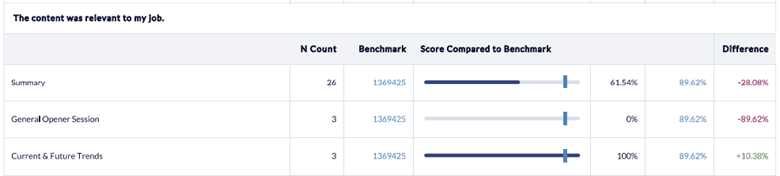
Summary
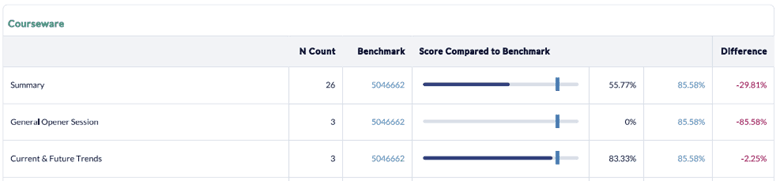
The summary section shows a summary score for the overall performance of the program survey question categories and individual scores for each of the question categories to allow you to determine where there may be opportunities for improvements. These scores are compared to the benchmark selected for this report and include N Count, Benchmark, Score Compared to the Benchmark and the Difference between the overall program score and the benchmark score.
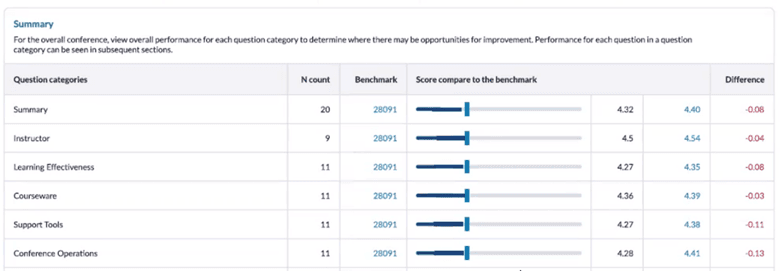
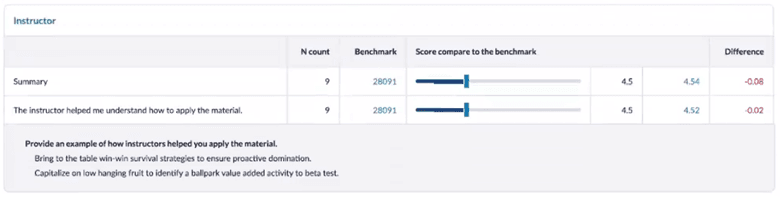
In addition, each individual question category is listed separately with its summary score and a graphical representation of the score compared against the benchmark. Any comments entered in response to open-ended questions are also listed, and questions offering multiple options display the response percentages per option.
What topics are covered in the individual program sessions section?
This area of the report focuses on making it easy for users to compare session performance and to identify strengths and opportunities for improvement.
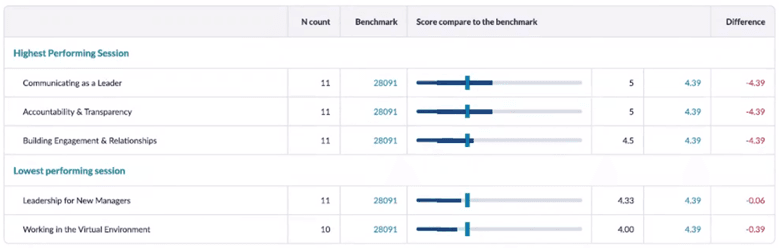
Highest and Lowest Performing Sessions
In this section, your highest and lowest performing session scores are displayed, including a comparison to the selected benchmark. This information could be especially helpful to understand which sessions were the most positively and negatively received by the program participants to help guide decisions for future sessions.
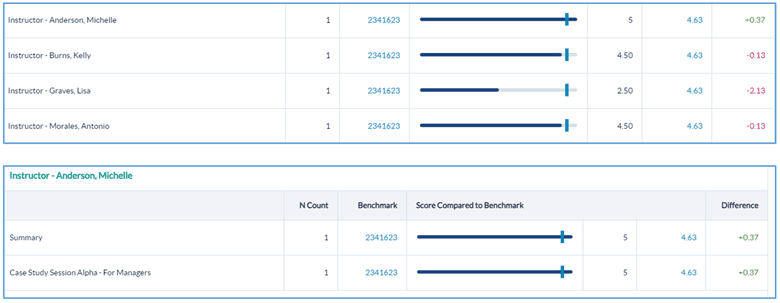
Summary
The remainder of the report displays all the question categories as well as question and instructor performance ranked for each session, including responses to open-ended questions and comments. This section is ideal for further analysis of individual session performance to determine whether changes should be made before your next program and what those changes could be.
Data Explorer can be used to further drill down into individual session data. Click here for more information about using Data Explorer.
Step-by-step instructions
Create and view Program Performance Reports
- Navigate to Reporting > Reporting.
- Select Ready Reports
- Click on the Program Performance Report icon.
PROGRAM PERFORMANCE QUERY
- Expand the Program Performance Query section.
- Select a Date Range in which the program was held.
- Click Search & Select Blended Learning Program.
- In the Blended Learning ProgramList pop-up window, the search results can be expanded by selecting a larger number of records per page from the drop-down menu, and/or the Search field can be used to locate the program.
- Select your program which will be displayed in the Selected Blended Learning Program field.
- In the Sessions Included in Report drop-down list, the Select All option will be shown by default, however individual session(s) or no session can be selected or de-selected instead.
- The Program Name will be displayed with the name of this report in the Report Name field.
- Run By Top Box - select this option if want to segment the data to view only the percentage of participants who selected the top options on the question numeric scale. If this option is not selected, the data will be displayed based on the numeric scale used for the questions in the survey.
- Aggregate Instructor Data - by default this report will aggregate instructor data for all of the sessions conducted. If you uncheck this box, the report will provide individual scores for each of the instructors for the sessions they conducted.
- Include All Comments - select this option if you want to include the open-text comments provided by the program participants.
- Include Student Demographics - select this option to view a breakdown of the student demographics collected for this survey.
BENCHMARK
- This report includes a Benchmark comparison based on your default Benchmark setting. To modify the Benchmark comparison for this instance of the report, expand the Benchmark section.
- Click Change.
- In the Benchmark Settings pop-up window, select a new Benchmark.
- Select Optional Benchmark Attributes for your report, if needed.
- Click Apply.
- Click Run Report.
Deaggregating instructors scores may result in a very long report depending on how many instructors participated at the program.
Schedule and distribute Program Performance Reports
Use this option for scheduling automated delivery of this report.
- Navigate to Reporting> Reporting > Ready Report
- Hover over the Program Performance Report icon, and click Schedule
PROGRAM PERFORMANCE QUERY
- Expand the Program Performance Report Query
- The Report Name: Program Performance Report will be displayed on your scheduled reports. Customize the report name to easily recognize this report when emailed. This is also important to allow you to differentiate your reports if you plan to schedule this report more than once for different audiences.
- Run By Top Box - select this option if want to segment the data to view only the percentage of participants who selected the top options on the numeric scale. If this option is not selected, the data will display based on the numeric scale used on the survey.
- Aggregate Instructor Data - by default this report will aggregate instructor data for all of the sessions conducted. If you uncheck this box, the report will provide individual scores for each of the instructors for the sessions they conducted.
- Include Comments - select this option if you want to include the open-text comments provided by the program participants.
- Include Student Data - select this option to view a breakdown of the student demographics collected for this survey.
BENCHMARK
- This report includes a Benchmark comparison based on your default Benchmark setting. To modify the Benchmark comparison for this instance of the report, expand the Benchmark section.
- Click Change.
- In the Benchmark Settings pop-up window, select a new Benchmark.
- Select Optional Benchmark Attributes for your report, if needed.
- Click Apply.
FILTER ATTRIBUTES
- To add optional Filter Attributes to your report to narrow down the data that is included in this report, expand this section.
- Locate a filter that you would like to apply to this report and click Add .
- In the pop-up window, select one or multiple filter attributes which will be used to filter this report.
- Click Apply.
- Repeat these steps to apply additional filters.
SCHEDULE
- Expand the Schedule section to set up when Program Performance Reports will be delivered and to who.
- Deliver Report(s): Enter a numerical value between 0 and 730 days to indicate the number of days after the class finished when the report will be delivered.
- Report Delivery Time: Select one of the delivery time options listed in the drop-down box which will determine how many days after the blended learning program the reports will be automatically sent out. Post event surveys are typically open for 2 weeks, so we recommended scheduling the report around the 14th or 15th day mark to ensure that all responses have been received by the time the report is delivered.
- Send report(s) to:
- Me: select this option to send the reports to the email address defined in your profile.
- Other recipients: enter the email addresses of any other recipients who should receive the reports separate by semi-colons.
- Course Report Recipients: select this option if course report recipients should receive the reports.
- Enter an email title in the Subject field.
- The drop-down menu beside the email title provides a list of dynamic Tags which can be added to the title to designate the Program selected for this report. Position your cursor in the text where you would like to add the tag. Select the tag.
- Click Add to apply. Repeat these steps to add multiple tags.
- Enter a message in the Bodyfield.
- The drop-down menu beside the email body, provides a list of dynamic Tags which can be added to the message to designate specific information about the Program selected for this report. Position your cursor in the text where you would like to add the tag. Select the tag.
- Click Add to apply. Repeat these steps to add multiple tags.
- Click Schedule to complete the setup.
Manage Scheduled Program Performance Reports
- Navigate to Ready Reports and select the Scheduled Reports tab.
- Locate the report you wish to modify and click on the
 icon in the Action column beside your report. A drop-down list will appear allowing you to:
 - Audit your report. An audit log will be displayed indicating any changes that were made to this report.
- View the Report Delivery History to confirm that the report was delivered.
- Edit your report to make modifications such as timing, filters, etc.
- Delete your report if you no longer want to have it delivered automatically.
To view the Program Performance Report for only Blended Learning Programs held in North American locations, filter to those locations by selecting Add next to Locations, then select those locations from the drop-down list. You can also use the search tool above the drop-down list to locate and select additional locations.
- If you are automating reports to go out to individuals besides yourself, it is recommended to customize the email message that will accompany the report output. Enter information such as why are you sending this report to them and what do you expect them to do with the report. Including this information in the email will help to drive report usage and continuous improvement.
- You can schedule this report to go out in multiple ways to different individuals. These individuals will receive the report in the singular way it is configured here.
- To set up the Program Performance Report to go out to all of your instructors, contact your MTM support team. They can set up this report to go out to all of your instructors so that each instructor will only get reports for the sessions that they have taught.