Quick Question Report (Ready Report)
Overview
Introduction to the Quick Question Report
The Quick Question Report (also known as the QQR) displays summary, question category, and individual question scores for a single class (Class Query) or for all classes over a selected period of time (Custom Query). The QQR will also indicate the number of students (n-count) who submitted at least one response for both the question category and the individual questions. With the QQR, you can see a distribution of students' scores across the Likert scale you use on your surveys, or you can run the report to view the percentage of learners who selected the Top Box responses on your scale. This report can also be configured to include student demographic data (if collected on the survey) as well as learner comments. Additionally, the Class Query, run by Alphabetical Order, and the Custom Query can both be run to view a benchmark comparison of your class(es) data.
The Class Query version of the Quick Question report is real-time, meaning that it can be generated as student submissions are received rather than waiting for overnight processing (overnight processing is required for the Custom Query version of the QQR).
How Can I Use the Quick Question Report?
The Quick Question Report is helpful for analyzing a single class's performance or to analyze the question category and question-level performance of an entire course, program, location, instructor, etc. over time. The QQR gives you very specific, detailed information about learner responses. With this report, you’ll be able to not only get an overall picture of how your classes are performing, but you’ll also be able to easily identify strengths and opportunities for improvement for your classes.
A good "rule of thumb" when reviewing a QQR is to examine how question category averages score against each other to identify which categories under-performed, either compared to other Question Categories or compared against a benchmark. Within those lower-scoring categories, you can then order individual questions from highest to lowest average result or highest to lowest performance against the benchmark to identify the driving cause of the low category performance.
Who Should Use the Quick Question Report?
In general, Instructors / Facilitators or other individuals who are responsible for monitoring individual class performance are the primary audience for the class-based QQR. Both the Custom and Class Query versions of the QQR can also be used in conjunction with other MTM reports to conduct root-cause analysis.
If run for more than one month or less, or for a single class, you can also see Learner Comments on this report, which will give you more anecdotal information about why students scored classes the way that they did and use that information to drive continuous improvement for your classes
This report supports both class and blended learning program (program level and session) data.
Job Aid
This following information will help you understand how to interpret and use the Instructor Quick Question Report.
To download a PDF version of this job aid, click Quick Question Report - Job Aid.
What does this report include?
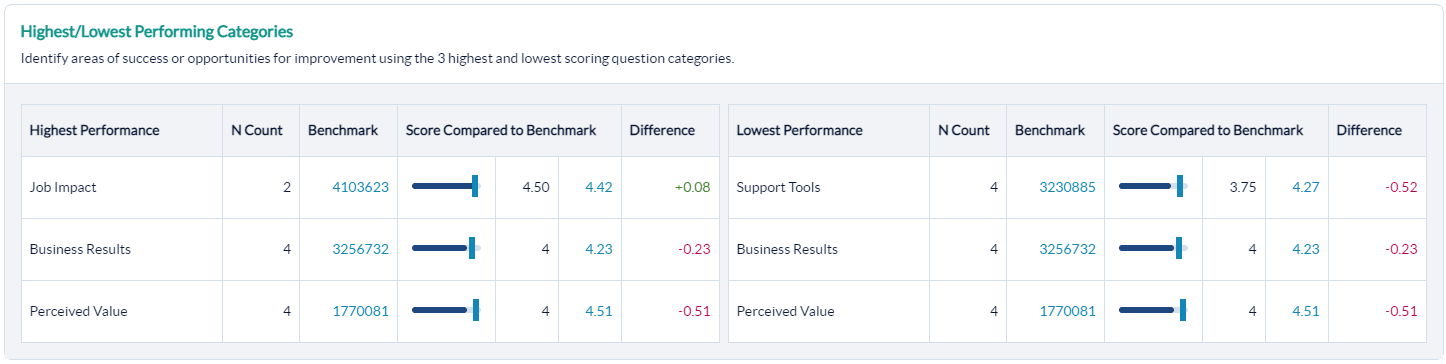
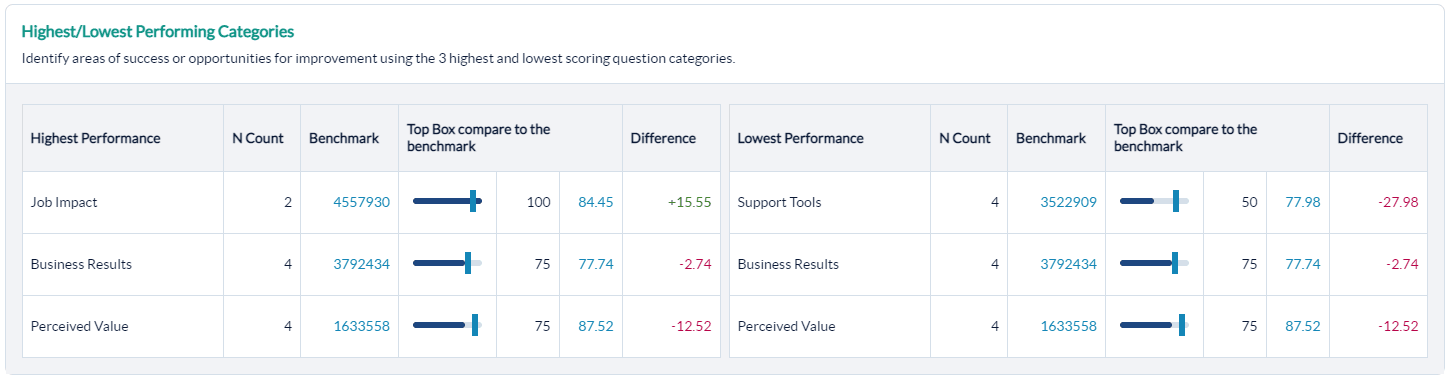
Highest and Lowest Performing Categories
Easily identify areas to highlight as wins as well as areas to focus on for improvement. Running the report in Alphabetical order will also allow for the inclusion of a benchmark for further analysis and comparison.
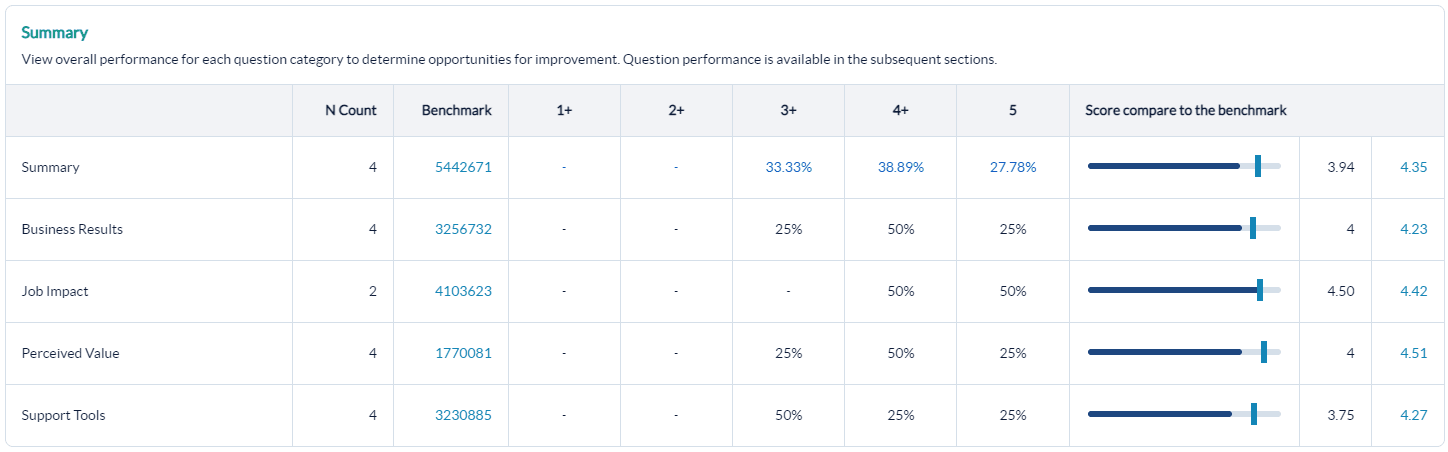
Summary
Standard Report (Likert scale display) - Your class has an overall average score when running a standard report. The score is driven by the questions in each of the categories listed in this section of the report. N-counts reflect the number of students who submitted at least one response in each category. View the distribution of scores across the scale used to determine how most learners scored in each category and where you may have outliers in your data.
Top Box Display (optional) - Your class has an overall summary score of the % of learners who selected the top responses on your numeric scale. Use the Top Box distribution to determine which question categories had the most overall positive scores.
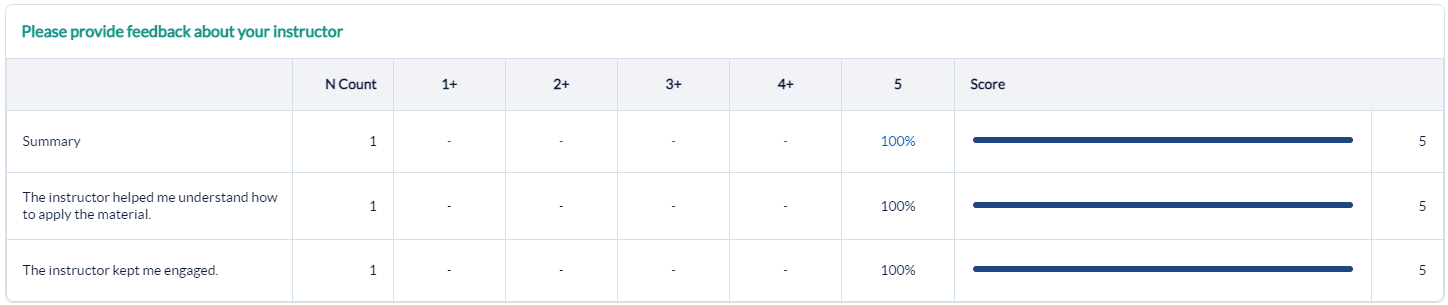
Instructor
Use the results in the Instructor Question Category to evaluate and manage your performance and drive positive outcomes.
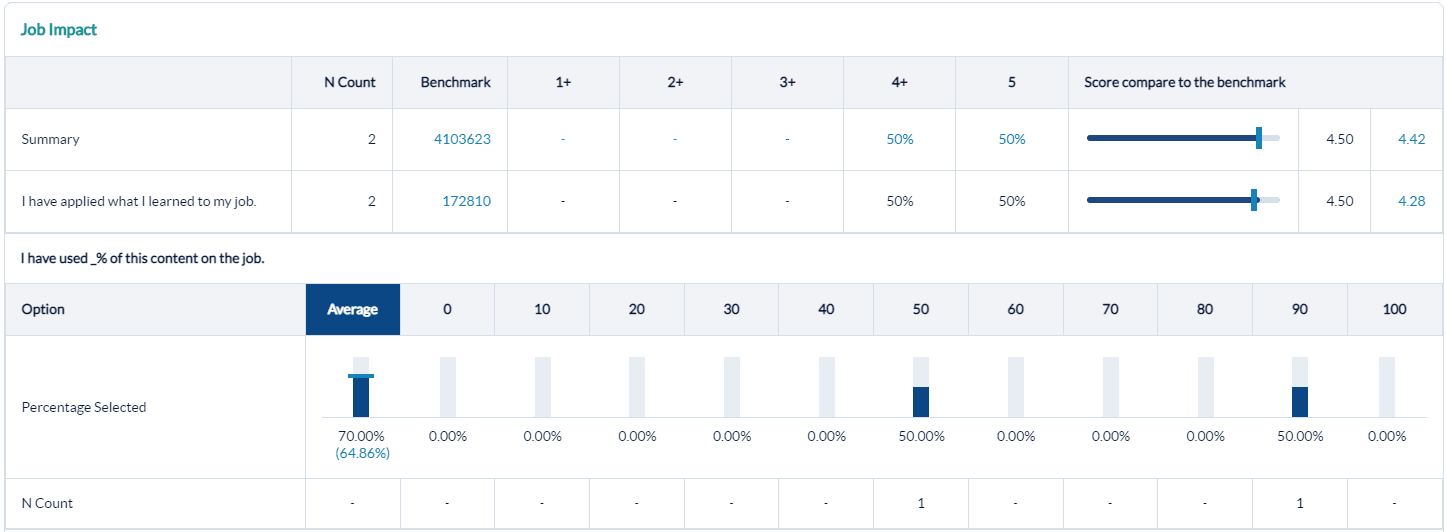
Job Impact
Application of training is the ultimate goal. If Job Impact scores are low:
- Ensure your instructional design and instructor-readiness processes focus heavily on connecting the new knowledge and skills with the daily professional lives of the learners.
- Clearly communicate course objectives, prerequisites, and target learners for all courses, both before training and throughout the training experience.
- Ensure your programs provide useful post-training support tools, including helpful materials and ongoing manager support.
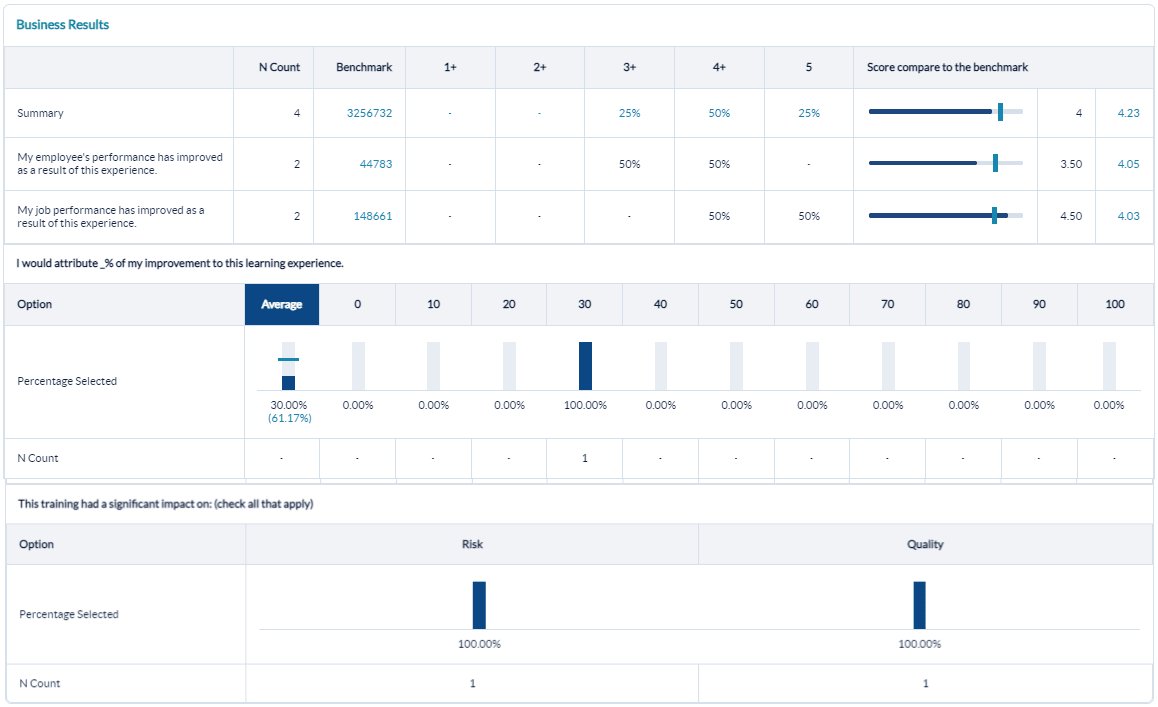
Business Results and Performance Improvement
Analyze the Business Results category to ensure learners are connecting the training to the desired business outcomes. Ensure learners can articulate business impact by the end of training.
Verify that this training experience is resulting in improved on-the-job performance.
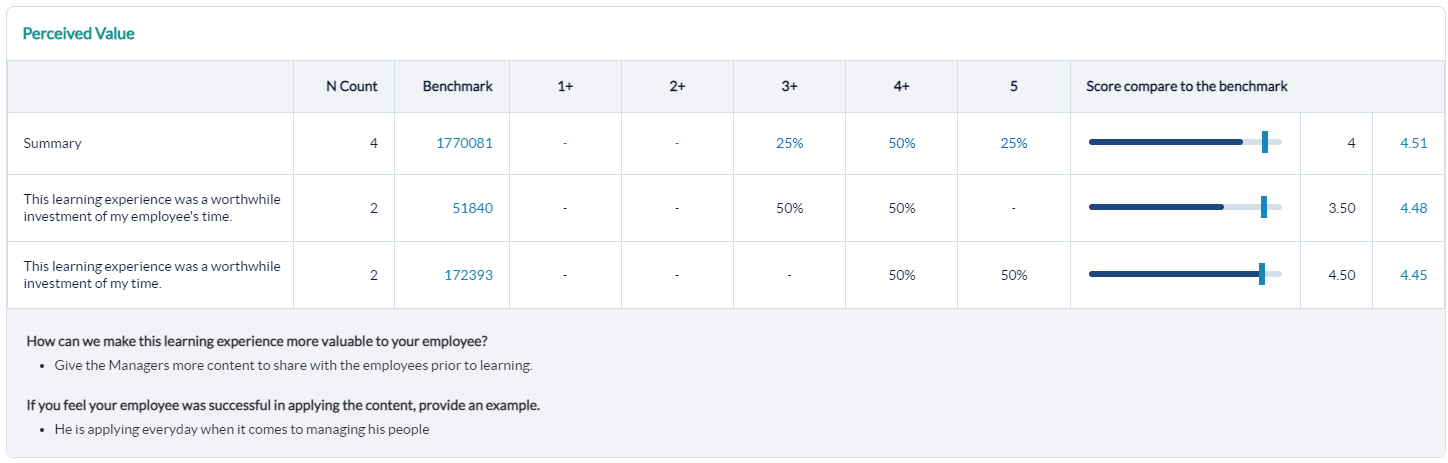
Comments
Analyze your Learner Comments to get first-hand information from learners about what to maintain and what to improve. Use the comments to highlight wins and drive continuous improvement. Examples of how learners plan to apply the training can be shared with future classes to help students connect the training with their job performance.
Multi choice answer options with no data collected are hidden from reports to streamline and condense the report output. The hide multi choice options with no data setting is the default setting in Administration - Report settings and can be changed to include all options, if needed. Numeric / percentage-based questions like NPS and job application will still show the distribution across the entire scale, even for unselected answer options.
Measuring Benchmark Performance with the Quick Question Report
The Quick Question Report, both the Class Query and Custom Query, provide the ability to benchmark your class/classes results. Benchmarking for a single class (Class Query) will only be available when you select Alphabetical from the Category Sort Order drop-down menu. Benchmarking is also available when running a Custom Query for the Quick Question Report.
Benchmarking at the individual question level is only available for numeric scale (Likert) questions. Net Promoter Score (NPS)and NPS benchmark will both display as a percentage.
Top Box Dividing Line Display
If you select to run the Quick Question Report by Top Box, MTM will calculate the percentage of learners who selected one of the top two options when filling out the survey. However, if your scale changes from the data collection (student survey experience) to reporting, that will impact how your Top Box dividing line on the Quick Question Report will display.
The Top Box dividing line and label WILL display if*:
- All responses were collected in the same Likert scale AND
- Reporting scale is equal to or larger than collected survey scale
*Note that this could include more than the top "two" box options.
The Top Box dividing line and label WILL NOT display if:
- Multiple Likert scales were used at the time of collection
- Reporting scale is smaller than collected scale
- Reporting scale is reversed from the collected scale
If the Top Box dividing line cannot be displayed, the reporting user will instead see text stating, "The Top Box dividing line cannot be displayed for sections where data was converted from a larger scale or multiple scales."
Low Scores in Question Categories - what could they mean?
Low scores in different question categories have different implications. These could include, but are not limited to:
- Courseware:Issue with the course design, including content, flow, learning activities, real-world examples
- Instructor:Instructor was not effective in his/her delivery style, student engagement, teaching for application, expertise, ability to field questions
- Environment: The physical environment was uncomfortable or did not promote learning
- Learning Effectiveness:Low probability of impact due to poorly designed course, a mismatch between the learners and the target audience, training was not "just-in-time." Learners may also have not understood why they were there, which prevented them from being open to the learning experience.
- Job Impact:Similar to Learning Effectiveness, as well as an indication of perceived barriers to impact due to lack of time, management support, lack of opportunity, or lack of applicability to the job
- ROI:Perceived costs were higher than benefits
- Support Tools:Lack of manager support prior to or following the training, lack of on-the-job support materials, training didn't align with the goals and culture of the organization
Quick Question scale display
On the Quick Question Report, you'll notice that the Likert / numeric scale displays each number as a range (ex: 1-1.99, 2-2.99, etc.). The scale represented indicates the reporting scale you have set in your MTM account. However, MTM has the ability to take data collected using multiple scales (5-point, 7-point, etc.) and report on it on one common scale to ensure consistency in reporting. In scaling either up or down, many responses collected on the non-default scale will no longer be whole numbers. The scale display on the Quick Question Report lets the user know where the values that aren’t whole numbers are included.
The scale range is hard-coded into the report's display and will appear regardless of your survey and report scale settings.
Average score for percentage based questions
In the Quick Question Report (Ready Report), the number of people and percentage of people who responded with a specific percentage are listed directly above the answer option.
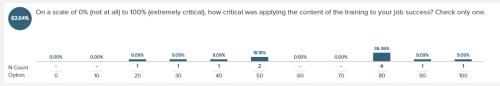
If you need to find the average of those scores- the circle to the left of the question contains the average score for that question.
Step-by-step instructions
Create and view a Quick Question Report
To report on one specific class, run a Class Query of the Quick Question Report.
- Navigate to Reporting > Reporting > Ready Reports
- Expand the Quick Question Query section.
- Select the radio button for Class Query under Query Type.
- Select a Date Range to include the class end date of your class.
- Select the Category Sort Order:
- Evaluation order - will display the results in the order shown on the evaluation form.
- Alphabetical- will list the question categories in alphabetical order.
- Click Search & Select Class.
- Select the Class for which you want to run the Quick Question Report.
- (Optional) Customize the Report Name for easy future retrieval.
- (Optional) Check or uncheck: run by Top Box, Aggregate Instructor Data (checked by default), Include All Comments and Include Student Demographic.
- (Optional) If including a Benchmark, you can modify the Benchmark by expanding the Benchmark accordion and selecting a different Benchmark option.
- Click Run Report.
To report on multiple classes in a date range, you can run a Custom Query of the Quick Question Report.
- Navigate to Reporting > Reporting > Ready Reports
- Click the Quick Question icon
- Check Custom Query under Query Type
- Adjust the Date Range to the time frame of data you want to include in the report
- Optional) Customize the Report Name for easy future retrieval.
- (Optional) Check or uncheck: run by Top Box, Aggregate Instructor Data (checked by default), Include All Comments and Include Student Demographics
- (Optional) You can modify the Benchmark by expanding the Benchmark section and selecting a different Benchmark option.
- (Optional) Apply any report Filters by expanding the Filter section and selecting your filter options.
- Click Run Report.
Benchmarking can only be included when you run the report in Alphabetical order.
Schedule and distribute Class based Quick Question Reports
Communicating class performance results to instructors / facilitators or other individuals who are responsible for monitoring individual class performance in a timely manner ensures they have the data they need to continuously improve their training effectiveness.
- Use this option for scheduling automated delivery of this report.
- Navigate to Reporting> Reporting > Ready Report
- Hover over the Quick Question Report icon, and click Schedule
- Select the class based type of report in the pop-up window.
QUICK QUESTION QUERY
- Expand the Quick Question Query section.
- The Report Name: defaults to Quick Question. You can customize the report name to easily recognize this report when emailed.
- Select the Category Sort Order from the drop-down menu.
- Alphabetical (A-Z) - the questions will appear in alphabetical order.
- Evaluation - the questions will appear in the order they were was presented to the learners.
- To view the Question Categories, click the drop-down menu for this field. Click the check box beside one or multiple categories to include them in your report.
- Run By Top Box - select this option if want to segment the data to view only the percentage of participants who selected the top options on the numeric scale. If this option is not selected, the data will display based on the numeric scale used on the survey.
- Aggregate Instructor Data - select this option to aggregate instructor data for the classes.
- Include Highest / Lowest Performance Categories - select this option to report on highest and lowest performance categories instead of all categories.
- Include Comments - select this option if you want to include the open-text comments provided by the survey respondents.
- Include Student Demographics - select this option to view a breakdown of the student demographics collected for this survey.
BENCHMARK
- This report includes a Benchmark comparison based on your default Benchmark setting. To modify the Benchmark comparison for this instance of the report, expand the Benchmark section.
- Click Change.
- In the Benchmark Settings pop-up window, select a new Benchmark.
- Select Optional Benchmark Attributes for your report, if needed.
- Click Apply.
FILTER ATTRIBUTES
- To add optional Filter Attributes to your report to narrow down the data that is included in this report, expand this section.
- In the pop-up window, click on the Add button beside a filter you wish to select.
- Click the check boxes of the options listed for this filter you wish to include in this report.
- Click Apply.
Repeat this process to select additional filters.
- Use Class Average Filter - click on the check box beside this option and enter a value in the Class Average Threshold field to add this option to your report.
SCHEDULE
- Expand the Schedule section to set up when the Quick Question Report will be delivered and to who.
- In the Deliver Report(s) field, enter a numerical value between 0 and 730 days to indicate the number of days after the class finished when the report will be delivered.
- Report Delivery Time: Select one of the delivery time options listed in the drop-down box which will determine how many days after the event (class or blended learning program) the reports will be automatically sent out. Post event surveys are typically open for 2 weeks, so we recommended scheduling the report around the 14th or 15th day mark to ensure that all responses have been received by the time the report is delivered. If the survey is completed in class, we recommend setting the delivery date to 1 day.
- Send report(s) to:
- Me: select this option to send the reports to the email address defined in your profile.
- Other recipients: enter the email addresses of any other recipients who should receive the reports separate by semi-colons.
- Course Report Recipients this option if course report recipients should receive the reports.
- Enter an email title in the Subject field.
- The drop-down menu beside the email title provides a list of dynamic Tags which can be added to your report title to designate the data contained in this report. Click on the radio button beside a tag.
- Click Add to apply. Repeat these 2 steps to add multiple tags.
- Enter a message in the Bodyfield.
- The drop-down menu beside the email body, provides a list of dynamic Tags which can be added to the message about specific information included in this report. Place your cursor in message at the location where you would like to add the tag. Click on the radio button beside the tag you would like to add and click Add.
- Repeat these steps to add multiple tags.
- Click Schedule to complete the setup.
Users can schedule multiple versions of the same class-based report, which enable them to respond to the needs of various audiences by:
- applying different filter attributes
- applying different benchmarks
- scheduling multiple reports to the same audiences (such as a Post Event report and then a Follow Up report 90 days later)
This does not apply to group scheduling. If you need to send different reports to various instructors, contact your Customer Success Manager or support@explorance.com to create multiple instructor groups to send different reports to different groups.
There is no limit to the number of class-based reports a user can schedule in the same user account.
For Aggregate Instructor Data, if your class(es) have multiple instructors, by default MTM will aggregate all instructor data together. To report on each instructor separately, remove the check from this option.
Use this option to limit the number of reports to recipients. Reports will only be generated and delivered for classes where the class average score falls below the class average threshold you have set.
Course Report Recipients are assigned to specific courses and must be first set up by your MTM Administrator. They will only receive this report when a class of a course has been assigned to them.
Instead of seeing that the Courseware category displayed as a score of 4.9 on the 1-5 numeric scale, you would see that 95% of the participants selected one of the top options on the scale when the Run by Top Box option is clicked.
- If you are automating reports to go out to individuals besides yourself, it is recommended to customize the email message that will accompany the report output. Enter information such as why are you sending this report to them and what do you expect them to do with the report. Including this information in the email will help to drive report usage and continuous improvement.
- You cannot schedule this report to go out in multiple ways to different individuals except for the Course Report Recipients. Everyone else selected will receive this report in the singular way it is configured here. To send different sets of filtered data to different individuals you will most likely want to set up aggregate scheduled reports.