Report Card Report (Ready Report)
Overview
Introduction to the Report Card Report
The Report Card is a powerful report that allows you to compare category and question-level responses against a relevant benchmark to quickly analyze performance strengths and opportunities. This report first provides a summary of key metrics including Scrap Learning, Net Promoter Score, and Adjusted Percent Improvement due to training. This Key Metrics summary section is designed to facilitate the analysis of your learning programs by pulling important insights out of the report for you.
Additionally, the Report Card offers an optional Key Metrics Recommendations output. The Key Metrics Recommendations provide a Key Driver analysis, which is an advanced statistical method to answer the question, "Why is 'x' happening?" within your learning programs. This analysis explains the reasons why you might see changes in your Key Metrics (NPS, Scrap, or Performance Improvement). You can use the Key Metrics Recommendations to obtain precise, prescriptive insights, delivered with greater statistical confidence, to make decisions and take action in order to drive continuous improvement of your learning programs.
How can I use this report?
The Report Card provides a quick and easy snapshot into the areas of your learning programs that are performing either above or below the selected benchmark. It shows how your company is performing by question category and by question for all aggregate class data in a date range, and compares your results against a benchmark. This report can also be customized using filters to narrow down the focus of your data analysis.
You can also customize the benchmark to match your custom filter selections, enhancing the power of this report. This report is useful for identifying the drivers behind high and low performing question categories in addition to providing a summary of overall performance. You might want to use the Report Card as an executive-level report; for example, a VP in your organization wants to see how all students rated the Job Impact category for all classes delivered last month in comparison to the MTM benchmark or compared against all other Corporate Universities.
Who should use this report?
Due to its ability to provide both high-level and question-level performance, the Report Card can be used by a variety of reporting stakeholders within your organization.
- Course Owners can use the Report Card, filtered to their particular portfolio, to monitor and manage the performance of their courses over time.
- Learning Analysts can use the Report Card to identify opportunities for improvement in learning programs and the drivers behind low scores.
- Executive-level audiences can use this report to monitor job application and overall learning programs' performance.
Job aid
This following information will help you understand how to interpret and use the Report Card Report.
What does this report include?
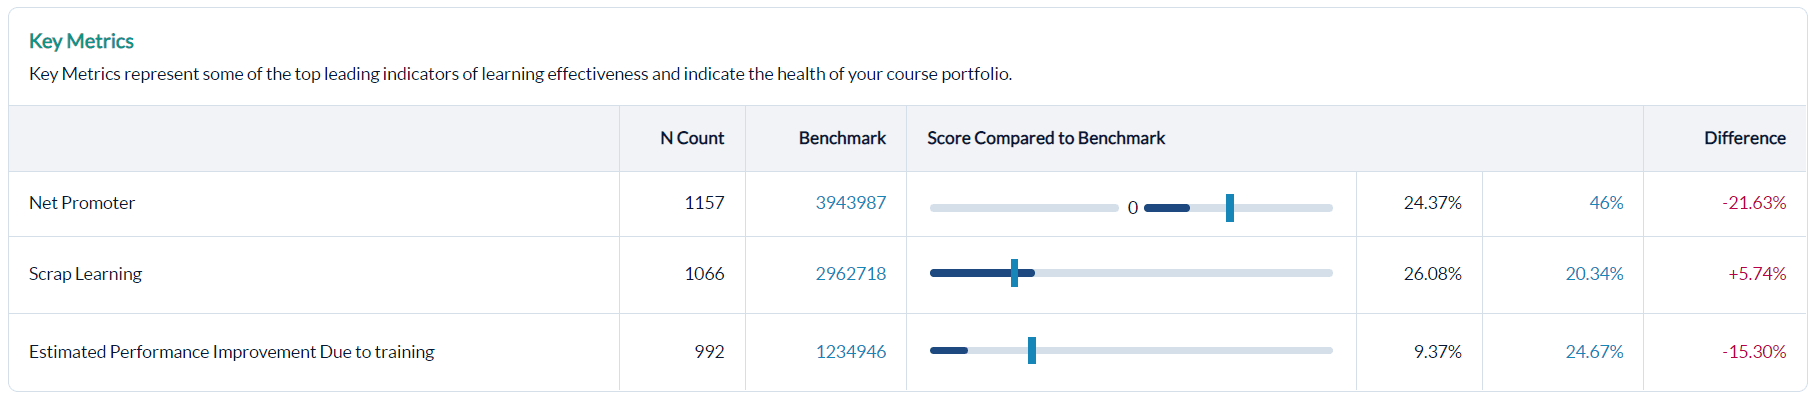
Key Metrics Summary
The Key Metrics Summary Report provides quick insights into learning programs’ performance compared to a benchmark. Use this summary to communicate overall performance to stakeholders and to identify areas in need of further analysis. Run the Key Metrics Recommendations to determine which training issues are causing high / low performance among your key metrics. More details to facilitate this analysis, including question-level scores, are also located further down in this report.
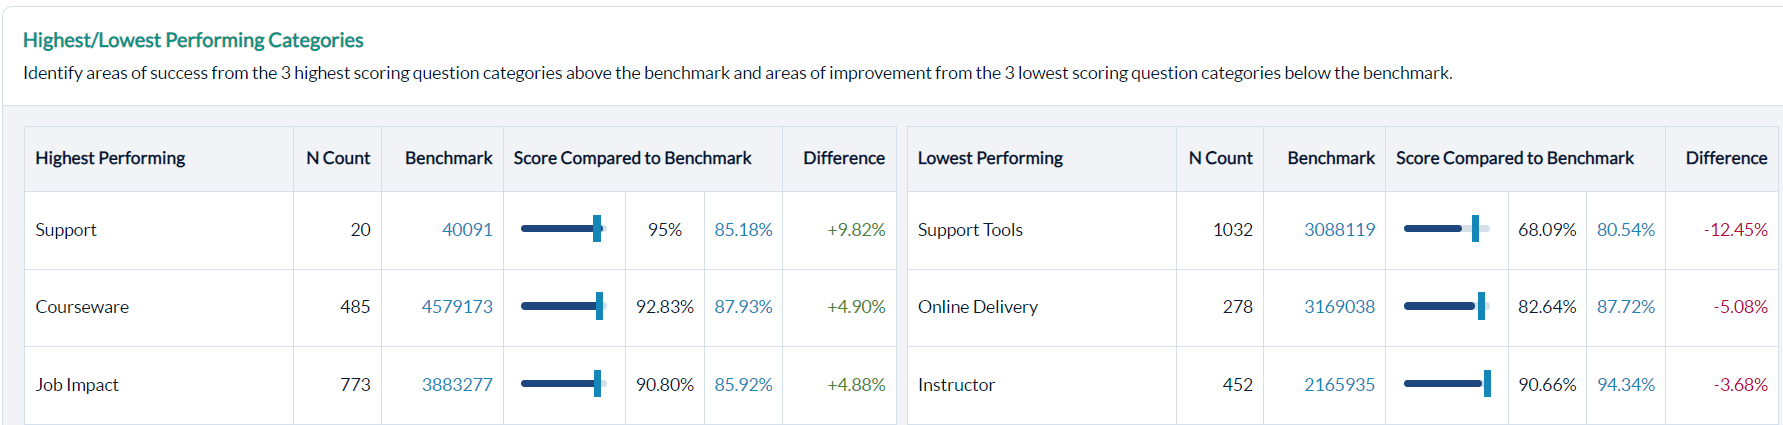
Highest and Lowest Performing Categories
Easily identify areas to highlight as wins as well as areas for improvement.
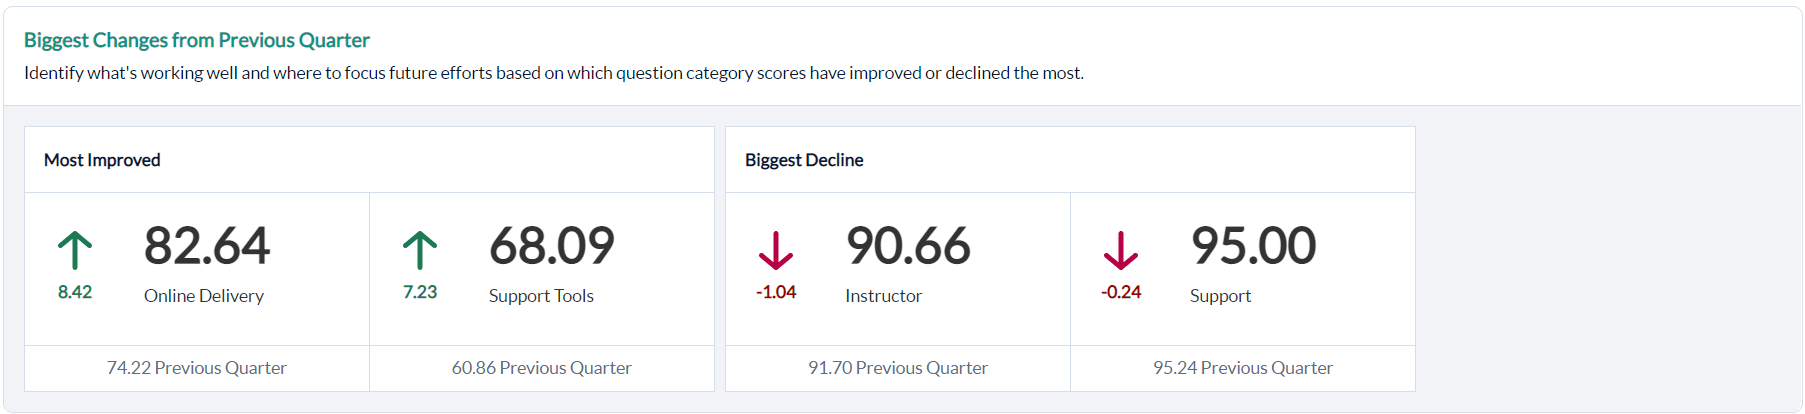
Biggest Changes for a selected Date Range (previous day, month, quarter, year)
Use this section to determine where current efforts have paid off as well as where to focus future efforts.
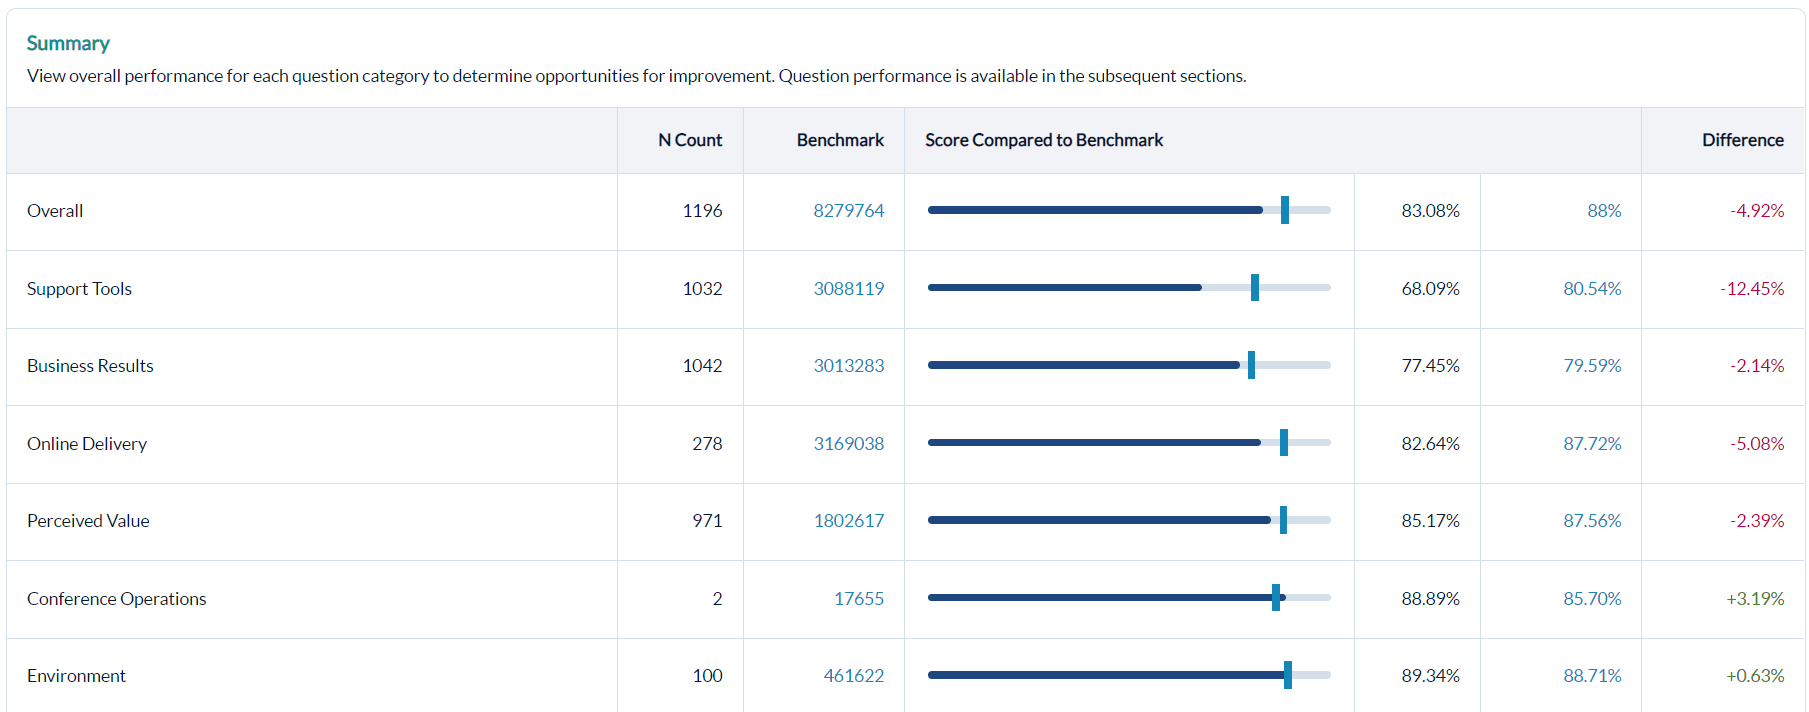
Summary
View overall performance compared to a benchmark. Category-level performance is ranked bottom to top.
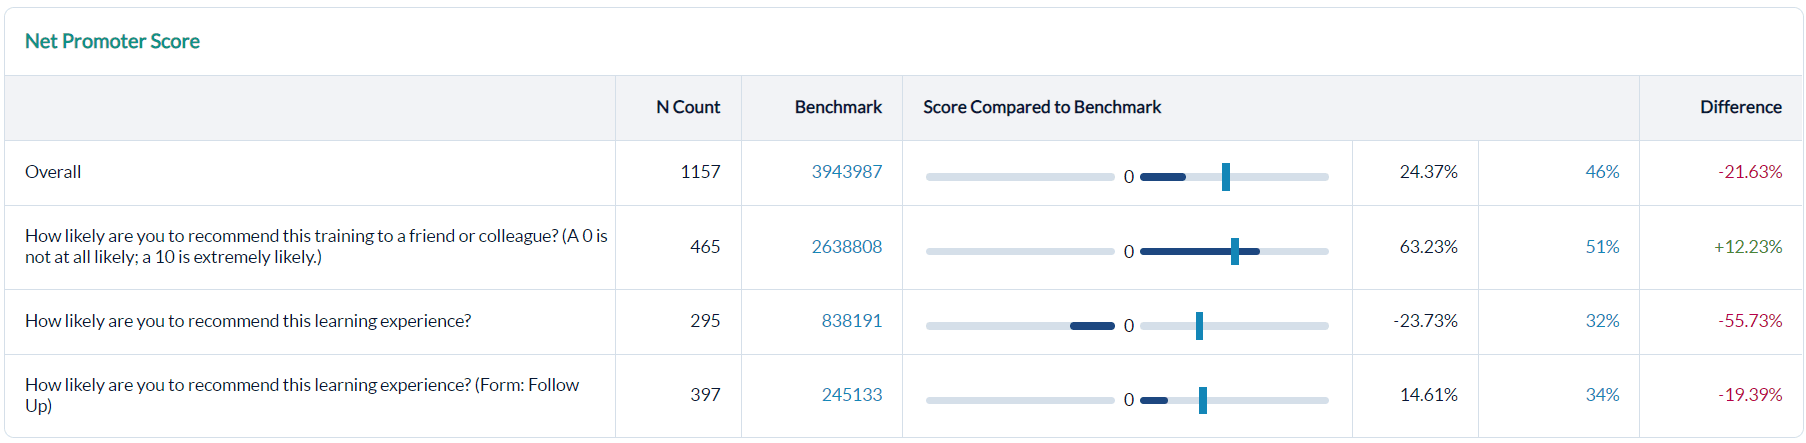
Net Promoter Score
Net Promoter Score = Promoters – Detractors
(Promoters = 9 & 10, Passives = 7 & 8, Detractors = 0 – 6)
If Net Promoter is low:
- Ensure that the correct audience is attending training.
- Examine question categories with low scores to determine what's driving detractors.
- Review learner comments to look for room for areas to improve,
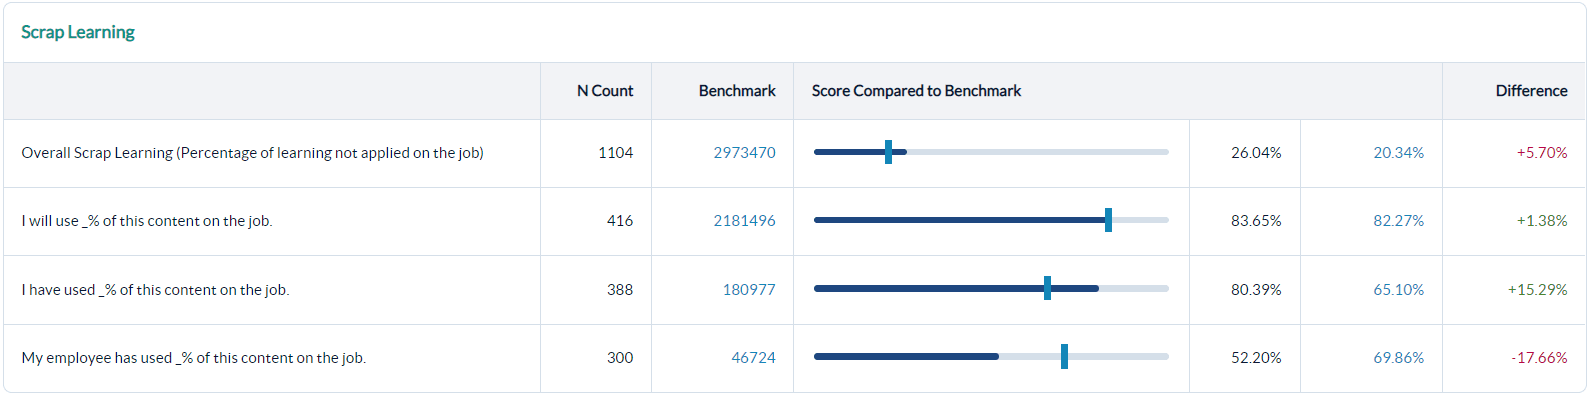
Scrap Learning
Scrap = learning not applied on the job. The question scores are averages to make it easy to understand how respondents answered each scrap question. If scrap learning percentages are high:
- Run the Scrap Learning Report to determine what is driving scrap
- Analyze the recommendations portion of this report for recommendations and tactical steps to decrease scrap.
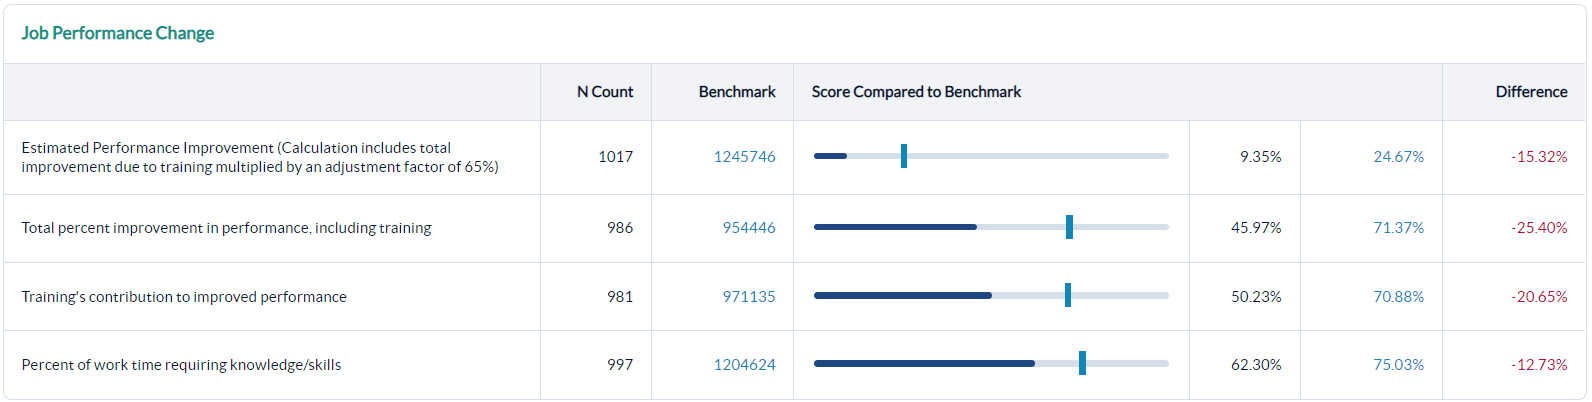
Job performance change
Isolate training’s impact on job performance to drive value. If there is a low adjusted % improvement, this could indicate an issue with the intended learner audience, courseware, or support tools. Review question categories with low scores and learner comments to determine drivers. Use Data Explorer for root-cause analysis.
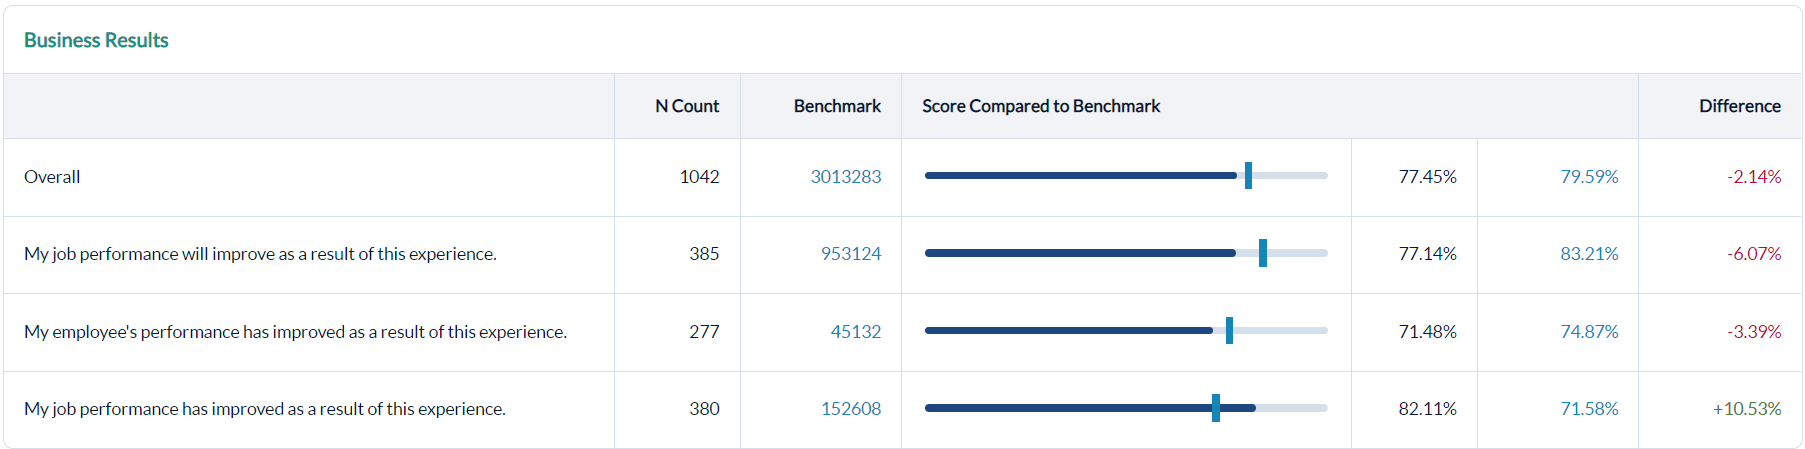
Question Category and Question-Level Performance
See category and question-level performance to identify areas driving lower performance as well as areas to maintain higher performance. Categories will appear on the report ranked from lowest to highest performance.
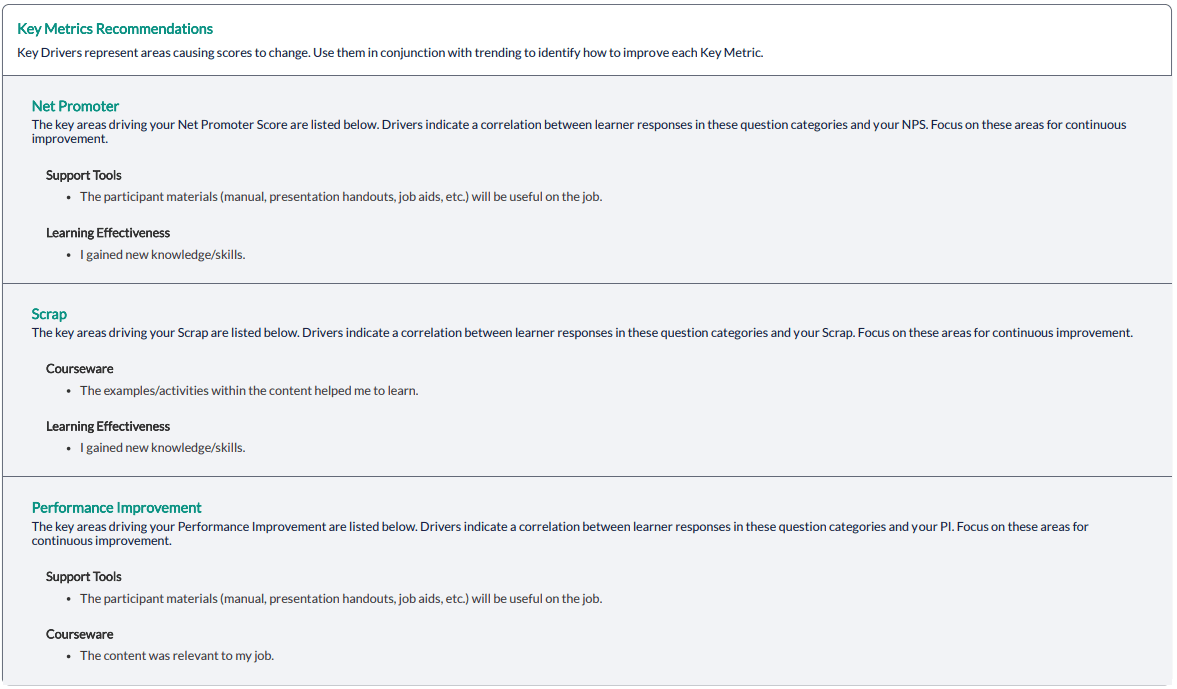
Key Driver Analysis Recommendations
The Key Metrics Recommendation companion to the Report Card provides an advanced statistical method to answer, “Why is ‘x’ happening?” within your learning programs. This analysis will identify the areas that drive performance for you key metrics. Using the precise guidance from this statistical methodology, you can make decisions and take actions to drive results and continuous improvement in your learning programs.
To run the key driver analysis:
- there must be at least 6 unique standard questions (QIDS).
- at least 6 questions must have a response rate of 55%.
- there must be at least 100 evaluations collected.
Step-by-step instructions
Create and view a Report Card Report
- Navigate to Reporting >Reporting> Ready Reports.
- Select the Report Card icon.
- Select the Date Range.
- Select the Start Date.
- Select the End Date.
- To view respondents who chose the top answer options in their response, click the check box beside Run by Top Box.
- To include Key Metrics Recommendations as a companion output for your Report Card, click the check box beside Include Recommendations.
- (Optional) Modify the Report Name displayed to differentiate this report from others you have already generated or may generate in the future.
- To include available benchmark data next to your scores for each line item, click Use Benchmark in the Benchmark accordion.
- Click Change to use a different benchmark from your default benchmark setting and select another benchmark that will apply to only this report. Once you navigate away from this window, the benchmark setting will return to the default settings.
- To Apply Filter to Benchmark, click the check box.
- Run Report.
Schedule and distribute a Report Card Report
- Navigate to Reporting >Reporting> Ready Reports.
- Click on the Queued Reports tabs.
- Locate the Report Card Report you wish to schedule.
- In the Action Column, click on the gear icon.
- Select Schedule from the drop-down menu.
- Scheduled Report Name - Enter a name for the scheduled report.
- Select aQuery Date Range
- Dynamic Dates - Will pull your report query based on the predefined range selected from the drop-down menu. This is the most common selection.
- Original Dates - Will pull your report query based on the original date range you used to generate your report. - This would make your scheduled report a static report.
- Select the Frequency of Report Delivery from the drop-down menu.
- Select the End Frequency to determine how long your report will be automated, or how many reports you'll receive. Once the occurrence is over, you will stop receiving reports and will need to reschedule this report to continue receiving it.
- Select the date First Report Delivered On which represents the date the automated reports will begin. If you backdate a report, you will receive every instance of that report that would have previously been generated.
- Select Weekday or Everyday.
- Select the recipients.
- Me - Send the automated report to yourself.
- Other Recipient(s) - Enter the email addresses of each recipient, separated with a semicolon ( ; ).
- Course Report Recipient(s) - Send the report to the individual Course Report Recipients (CRR) who should receive this report.
- Enter the email content.
- Include DE link (optional) - Include a hyperlink to log into Data Explorer in the body of the email.
- Subject - The subject line of the email. We recommend entering the report name and its frequency.
- Body - We recommend you include a brief description of the report, why these individuals are receiving this report and what you expect them to do with the data.
- Select Update.
Tutorial
(Video) Run or schedule a Report Card Report
By scheduling a report to be sent to "Me", the report will be sent to the email associated with the account you are logged into. However, if you are impersonating another user, the report will be sent to that user's email.
Select the Select All option to send the report to all CRRs, including those who may be added in the future.