Blue Dashboard (Overview)
The Blue Dashboard is an add-on analytics module within the Blue platform. It is specially conceived to support data driven decision making at every level of the organization. Blue Dashboard contains two sub-modules:
- the individual dashboard
- the aggregate dashboard
The individual dashboard is the self-viewed dashboard for an individual within the organization. The responses displayed in this dashboard belong to this individual directly, for example all of the courses taught by this instructor, and this dashboard can only be viewed by this individual.
The aggregate dashboard analyzes results at the organizational level or per unit level. With core statistics, summary view, trend analysis, breakdowns, and smart confidentiality filtering, stakeholders at every level of the organization can safely explore and make data driven decisions based on the collected data.
Publishing process overview
The publishing process is done in 3 main steps:
- Prepare - Configure the Blue Dashboard. Both the individual and aggregate dashboards are configured together using the following 14 steps, each of the individual dashboards and aggregate dashboards can be turned on or off with it's own access control, also described below.
- Preview - Before making the new dashboard content available to a larger audience, you can first select a few users to validate the content of their individual dashboards, or select a specific group to preview the aggregate dashboard.
- Publish - Access to the published individual dashboards can be restricted to specific users for the individual dashboard or select a specific group to view the aggregate dashboard.
The blue administrator is able to view both the aggregate and individual dashboard content by impersonating a specific user.
Consult the "Publish the Blue dashboard " topic for more information on the publishing process.
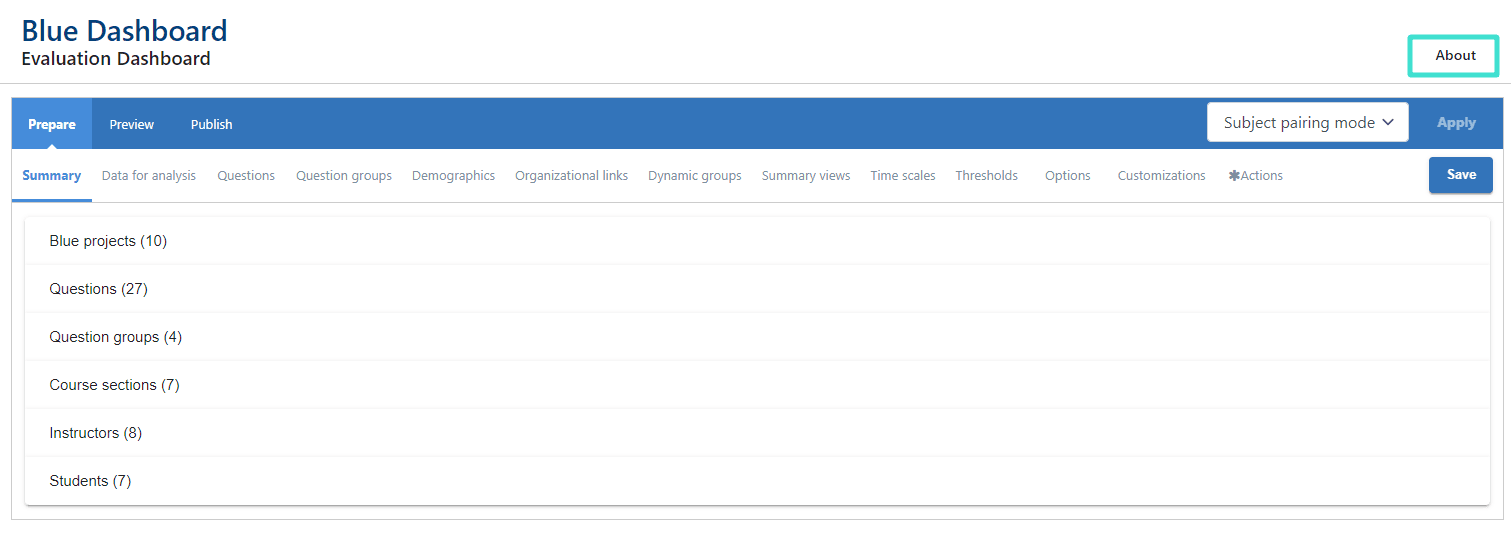
Prepare - configuration menu
- Select the Blue Dashboard mode:
- Subject only mode
- Subject pairing mode
- Summary - The summary allows administrators to quickly assess what projects and conditions are being used in the Blue Dashboard. Clicking on the different items expands the content.
- Data for analysis - Select which projects should be included in the Blue Dashboard.
- Questions - Select the Blue Questions from multiple projects and convert them into Dashboard Questions.
- Question group - Map Dashboard Questions to Question groups.
- Demographics - Based on Blue datasources, map the common demographics from multiple projects together. The selected demographic fields will be used for filters, listings, etc. in the Blue Dashboard.
- Organizational links - Organizational links represent the hierarchical structure of an organization. The links created here will be used to set up dynamic groups.
- Dynamic groups - Dynamic groups automatically ensure that only authorized users (i.e. Explorers) have access to the aggregate dashboard.
- Summary view - Configure widgets on the summary view page for each of the dynamic groups.
- Time scales - Create meaningful periods of time to best represent the organization's timeline.
- Thresholds - Configure minimum demographic thresholds to ensure individual respondents (students) cannot be identified in the content drill down.
- Options - Set the Blue Dashboard options.
- Customizations - In the Blue Dashboard, certain terms might deviate from your organization's. Instead of Question group, you might prefer a term such as 'competency'. You can edit some of these labels here.
- Actions - Once modifications to the Blue Dashboard configuration are made, they can be saved or dropped. Administrators can also revert to their previous preview or published configuration.
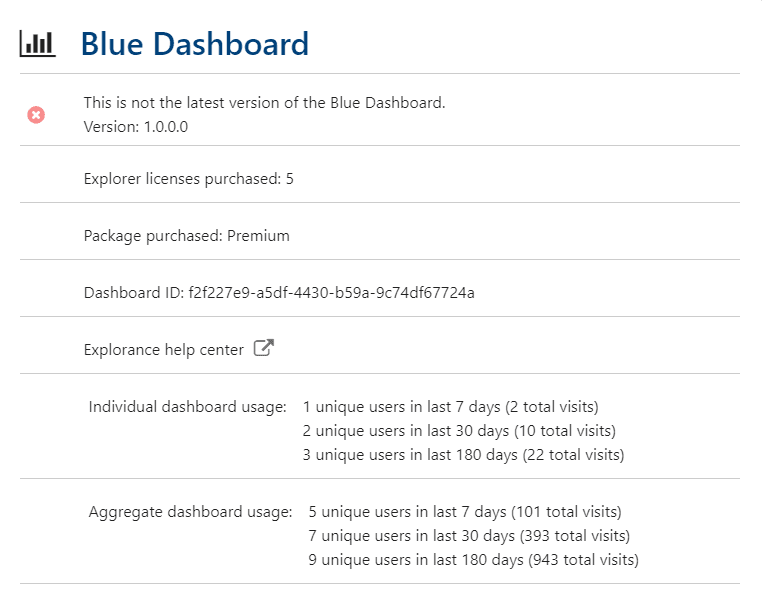
Blue Dashboard about page
The about page provides details about Blue Dashboard currently being used. Information includes:
- the version of the dashboard currently installed
- the number of Explorer licenses purchased (Explorers are able to access the aggregate dashboard)
- the type of license package
- the dashboard ID (a unique ID that can be used to communicate with Explorance support if an issue arises)
- basic dashboard usage tracking information (the individual and aggregate dashboard are tracked separately)
- usage tracking for the preview and published sites are combined together in these numbers