Data Extract (Ready Report)
Overview
Introduction to the Data Extract Report
The Data Extract tool allows you to request a raw data file from MTM containing all your learning programs' data, which includes data from Class surveys, Class Tests, Conference surveys, Conference tests, and / or Standalone tests. Having access to raw survey and test data gives you the ability to perform offline analysis of your data that MTM does not provide. Your request will be generated from the MTM Database and packaged into a compressed (.zip) file. The .zip file will contain two files, a character-delimited (.csv) file and an .xml file. The (.csv) file can then be imported into Excel or another data analysis tool for your own analysis. The raw data collected from this will provide a record for each answer included in your data extract.
How can I use this report?
Data Extracts can include any of the following combinations of data types: quantitative / likert answers (numeric scale-answer questions); non-likert answers (multi-choice and multi-select answer questions); comments / text (qualitative answer questions), demographic answer data and scored answers (test questions). With Data Extract, you can also choose which data sets / fields you would like to include in your report output and sort the order you would like for them to appear on your extract. This tool also allows for converting data scales to match your user preferences (i.e., reporting scale) or to retain the same scale used on the learners’ surveys.
After you submit your request, the report will begin generating immediately. You can continue to monitor the progress of your report in the Queued Reports section or navigate away from the report to work on other things. When completed, an email will be sent to the address tied to your user account with a link to download the report. You can also access your report in the My Files section. This section provides up to 50 MB of data storage and will save your reports for 5 days unless you delete them earlier.
Who should use this report?
Generally, organizations use the Data Extract for archiving data outside of MTM, accessing comments from multiple classes for easier searching / sorting, and for generating offline reports that are not available through MTM.
What fields are included in the report?
| Field | Definition / Business Requirements | Additional Notes | Classic Format | Crosstab Format |
|---|---|---|---|---|
| Answer | Response provided by the Student | Yes | Yes | |
| Answer Type | Type of answers for the question. | Note: Numeric Scale, Open Ended, Yes/No, Multiple Choice - Select one, Multiple Choice - Select Many | Yes | No |
| Attempts (Tests) | The number of times the student has completed the test so far | First submission starts at 1 and increases by 1 for every retake. | Yes | Yes |
| Blended Learning Program External ID | Client provided ID for overall Blended Learning (frm Conference) Programs | Yes | Yes | |
| Blended Learning Program ID | MTM ID for overall Blended Learning programs | Yes | Yes | |
| Blended Learning Program Name | Name for overall Blended Learning programs | Yes | Yes | |
| Business Unit | Custom group of learners determined by the client to aggregate their data in reporting | Yes | Yes | |
| Certified Instructor ID | ID given to an Instructor when they are certified by content provider | Primarily used by Learning Providers, will be -1 if not certified by a content provider | Yes | Yes |
| Certified Location ID | ID given to a Location by content provider | Primarily used by Learning Providers, will be -1 if not certified by a content provider | Yes | Yes |
| Client | Custom group of learners often based on learning partners, business sectors, etc. to aggregate their data in reporting | Learn more here | Yes | Yes |
| Correct Answer (Tests) | The correct answer to the question. | Is blank for questions without scoring. | Yes | Yes |
| Course Name | Name of course to appear to students and MTM reports | A Course is an object in the system that represents a training topic that can have classes scheduled for it by a learning provider. This is different than the unique class instance(s) where this course is being taught. For example: English 101 would be the course but the unique class instances of English 101 are taught at different locations and times. A Course is an object in the system that represents a training topic that can have classes scheduled for it by a learning provider. This is different than the unique class instance(s) where this course is being taught. | Yes | Yes |
| Course XID | Unique identifier for the Course passed from client system | This is a duplicate of the field External Course ID | Yes | Yes |
| End Date | Date the event being evaluated ends | Will be blank if the event does not have an end date | Yes | Yes |
| Enrollment Entered Date | Date the student was enrolled into the event | Yes | Yes | |
| Entered Date | The date the student submitted the evaluation | Yes | Yes | |
| Entered Time | The time the student submitted the evaluation | Times will display in eastern time zone | Yes | Yes |
| Entry Method | How the student submitted the evaluation | Options: Web Smartphone Options:WebSmartphone | Yes | Yes |
| Eval Submitted ID | MTM generated ID for each evaluation submitted | Yes | Yes | |
| Event ID | MTM generated ID for the event being evaluated | Event generally equals a class, session, or blended learning program | Yes | Yes |
| Event Name | Name of the event being evaluated | Normally the Course Name End Date | Yes | Yes |
| Event Type | Determines if the submission is evaluating a class, blended learning program, a blended learning session, or standalone test | Note: EventType differentiates if the data was collected against a standalone class (i.e. Formal Learning), a blended learning program Session, or the Overall blended learning program. You can use this to filter your data to specific eventType(s) or to compare performance between eventTypes, similar to how you would use learningmethod. | Yes | Yes |
| External Course ID | Unique identifier for the Course passed from client system | This is a duplicate of the field Course XID | Yes | Yes |
| External Event ID | Unique identifier for the Event being evaluated passed from client system. | Event generally equals a class, session, or blended learning program | Yes | Yes |
| External Instructor ID | Unique identifier for the Instructor passed from client system. | Yes | Yes | |
| External Location ID | Unique identifier for the Location passed from client system. | Yes | Yes | |
| External Student ID | Unique identifier for the Student passed from client system. | Yes | Yes | |
| External Vendor ID | Unique identifier for the Vendor passed from client system. | Yes | Yes | |
| Final Attempt (Tests) | Marks which submission was the final time the Test was completed | Yes = the last time the student submitted the test No = the student retook the test again after this submission | Yes | Yes |
| Form Name | The name of the survey or test the student submitted | Yes | Yes | |
| Form Type | The type of Survey submitted | Common options include: post event, follow up, instructor, manager, management, survey page | Yes | Yes |
| FormID | MTM generated ID for the survey or test the student submitted | Yes | Yes | |
| Group ID | MTM generated ID for the Group the session is a part of | Used for Blended Learning (Session Level surveys only) | Yes | Yes |
| Group Name | Name of the Group the session is a part of | Used for Blended Learning (Session Level surveys only) | Yes | Yes |
| Instructor Email | Email address of the instructor who facilitated the learning event | Yes | Yes | |
| Instructor Name | Name of the instructor who facilitated the learning event | Yes | Yes | |
| Language | Language in which the respondent submitted the form | Yes | Yes | |
| Learning Method | Mode the event was delivery in | Common Learning Methods are Instructor Led, Online Facilitated, Combination, and Self Paced Web Based | Yes | Yes |
| Location | Name of the Location where the training was delivered. Typically the city or facility name. | Yes | Yes | |
| Manager ID | MTM generated ID of the student's direct manager | Yes | Yes | |
| ManagerEmail | Email of the Student's manager | Yes | Yes | |
| Max Points Possible (Tests) | The maximum number of points possible on test, if every question was answered correctly | Yes | Yes | |
| Max Question Points Possible (Tests) | The maximum number of points possible from the question. | Yes | Yes | |
| Min Passing Percent (Tests) | The minimum number of points needed to pass the test, displayed as a percentage | Calculation: (Min Passing Score / Max score), rounded to 4 decimal points. | Yes | Yes |
| Min Passing Score (Tests) | The minimum number of points needed to pass the test. | Yes | Yes | |
| Organization | Name for the customer account which scheduled the training event. | For single organization account structures, this will always match Vendor | Yes | Yes |
| Organization ID | MTM generated unique ID for the Organization | Yes | Yes | |
| Pass Status (Tests) | Marks if the student passed or failed the test | Yes = Student passed No = Student failed Yes = Student passed No = Student failed | Yes | Yes |
| Points Received (Tests) | The number of points the student got right when they completed the test. | Yes | Yes | |
| Portfolio Name | Name of the Porfolio the course is assigned to | Portfolios categorize courses by business impact. | Yes | Yes |
| Question | Question Text | Yes | Yes | |
| Question Category | Name of the Question Category the Question belongs to | Yes | No | |
| Question Category ID | MTM generated unique ID for the Question Category | Yes | No | |
| Question ID | MTM generated unique ID for the Question | Yes | No | |
| Question Pass Status (Tests) | Marks if the submission passed or failed the question | Yes = Student passed No = Student failed Yes = Student passed No = Student failed | Yes | Yes |
| Response Score (Test) | Used when scoring = each correct response, shows how many points the student earned for each correct response (instead of the total points earned for the question) | Is blank when scoring = Entire Question | Yes | No |
| Student Email | The student's unique email address | Yes | Yes | |
| Student Name | Name of the Student who submitted the evaluation | Yes | Yes | |
| Student Percent (Tests) | The number of points the student got right when they completed the test, displayed as a percentage. | Calculation: (Points Received (Tests)/Max score), rounded to 4 decimal points. Value will display for all test questions, including those without scoring | Yes | Yes |
| Student Question Score (Tests) | The full credit score the student got when they completed the test. | Should display the total number of points the student received for the whole question, even if Scoring = Each Response, this should still be the total points for the question, not for just the row. | Yes | Yes |
| Vendor | Name for the customer account which scheduled the training event. | For single organization account structures, this will always match Vendor | Yes | Yes |
Step-by-step instructions
Run a Data Extract
- Navigate to Reporting > Reporting.
- Select Ready Reports
- Click the Data Extract icon.
DATA EXTRACT QUERY
- Expand the Data Extract Query section.
- Select a Date Range for your data.
- By default, the Data Types drop-down menu displays the following types selected: Likert, Non-Likert, Comments / Text and Demographics and Scored. To unselect any of these data types, click the check box beside the type name.
- By default, Normalize Data is set to Convert the downloaded data to the same scale as your user account preference. To view the raw data in the same numeric scale it was presented to the students, select Keep As Is from the drop-down menu.
- By default, the Data Layout is set to Classic: One answer per row. To modify this setting, select Crosstab: One survey per row from the drop-down menu.
- If you download raw data often, customize the name of your report in the Report Name field to easily locate this report for future use.
DATASET
- Expand the Dataset section.
- Select a dataset in either the Available Columns or Selected Columns and use the right and left arrows to add / remove data from the Data Extract.
- The up and down arrows allow you to re-order the data to customize the order each set appears in your final .csv file
The highlighted datasets in the Selected Columns are required for the data extract and cannot be removed.
FILTER
- This report allows you to select filters that will narrow down the set of data that is included in your report. To add filters, expand the Filter section.
- Click Create New Filter
- In the Filters pop-up window, select a filter by clicking Add beside one of the options.
- A list of the options for that filter will be displayed. At the top of the pop-up window, enter a name for this filter in the Filter Name field.
- Click the check box beside each Filter option that you wish to use for your report.
- Click Apply
- Repeat the last 2 steps to add multiple Filters to your report, if needed. Be sure to click Apply after each selection to save your filter.
- Click Save. The new filters will appear in the Saved Filter list at the bottom of the screen, checked for use with this report.
- Click Run Report.
The Data Extract Ready Report will be emailed to you as a zipped file, containing a .csv output. You can also access this file in MTM in My Files for up to 5 days after the report has been run.
A Single Use Filter allows you to filter the data of the report that you are currently preparing to run.
The Saved Filters are available for all reports throughout your MTM account.
Separate the data into columns
Once you have downloaded the .csv (comma-separated values) file, you can convert it to an .xlsx (Excel) file.
- Open your .csv file and highlight the entire A column.
- Click Data in the top toolbar and select Text to Columns.
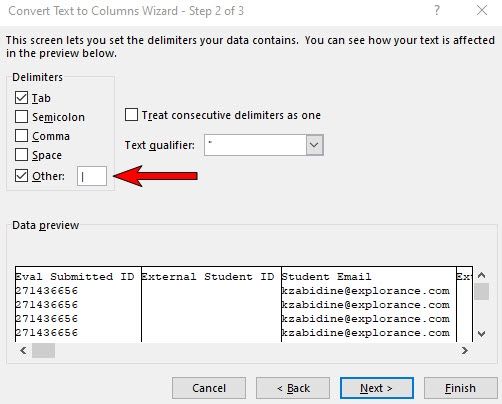
- Select Delimited.
- Click Next.
- Select Other then enter a pipe sign |.
- Click Finish.
- Now that the columns are separated, you can Save it in Excel format.