Create a BTA report
The real power of Text Analytics is in the reporting functionality built into Blue.
Text Analytics report blocks
The Text Analytics report blocks are designed to produce a clear and concise visualization of freeform feedback allowing project leaders to identify data anomalies and take appropriate action as never before.
By default the Text Analytics report blocks produce powerful visuals, but customizing various report block attributes can add even more impact to the data. All of the Text Analytics report blocks contain many of the same attributes.
Preview the Text Analytics report block at any time to see how changes to different attributes affect the output.
Let's take a look at the attributes common to all of the Text Analytics report blocks, then we'll follow with the attributes that are specific to each report block:
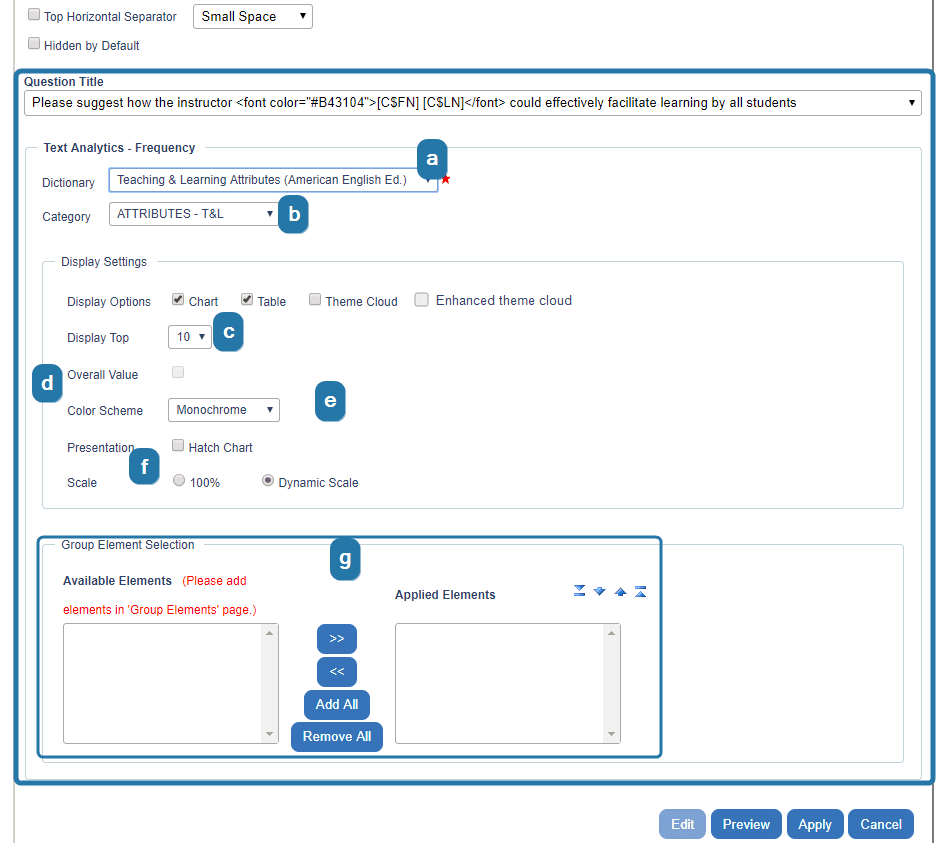
Custom BTA dictionaries are not compatible with the theme cloud. Only the enhanced theme cloud can be used with custom BTA dictionaries.
- More than one dictionary may be tasked with analyzing responses for the selected question. Choose the appropriate dictionary from the list first as this affects the available categories.
- Choose which top-level category in the dictionary is the category that will be analyzed in this report block.
- When the report is generated, it will determine which comments fit into the selected category. It then sorts the comments into specific themes. The themes with the highest number of comments are added to the report. The Display Top field allows you to choose the number of top ranked themes to include in the report (the number of "top" themes selected will always display even if they don't contain any comments).
- The results of the comment analysis are typically displayed as a percentage of the number of response received. Enabling Display Overall Value adds the actual number of responses for each theme, percentages are still displayed on the report as normal.
- Choose whether the chart and theme cloud will use a Positive/Negative color scheme, a Report defaults color scheme or a Monochrome palette.
- The Presentation includes an option to use hatching on the charts to make them more accessible and Scale option are able to adjust the range included on the chart scale (available only with charts and theme cloud).
- The final section, titled Group Element Selection, allows the Text Analytics results to be compared against other elements in the project. For example, using Group Element Selection, response data between two departments or between sections of the same course can be compared.
Beyond the common Text Analytics report block attributes, each type of report block also has unique attributes that are described below: