Using and understanding the Response Rate Monitor
The Response Rate Monitor provides the tools necessary to all levels of the organization to engage in monitoring ongoing evaluation projects, analyze response levels and act appropriately to achieve response rate targets. This is accomplished in three stages: monitor, analyze, and act.
This topic introduces some of the best practices and business cases for using the Response Rate Monitor. The information enclosed is primarily geared towards project managers and administrators that are responsible for ensuring the success of an evaluation project.
Blue administrators and project managers can access the Response Rate Monitor using the left side Blue Menu. Users that don't see the Blue menu on the left side of their homepage may be provided with a link to access the Response Rate Monitor. Regardless of how a user accesses the Response Rate Monitor, they will only be able to view and act on data that they have the appropriate rights to see based upon the groups they are members of and the permissions those groups have been assigned.
Analytics must be enabled in the Project - Task - Fillout - Options. Analytics data will only be collected after the Response Tracking Analytics have been enabled. Responses received before Response Tracking Analytics have been enabled will be reported as Not Captured. Learn how to Enable analytics data collection.
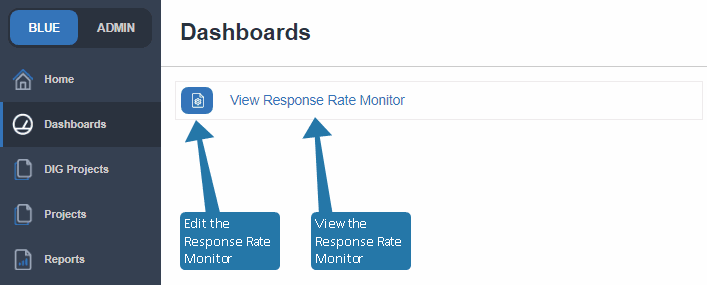
The Response Rate Monitor is accessed by navigating to the Blue Project Management console - Dashboards. From here it is possible to edit the Response Rate Monitor by clicking on the icon and viewing the Response Rate Monitor by clicking on the View Response Rate Monitor title.
Newly submitted responses take approximately ten minutes to propagate to the Response Rate Monitor.
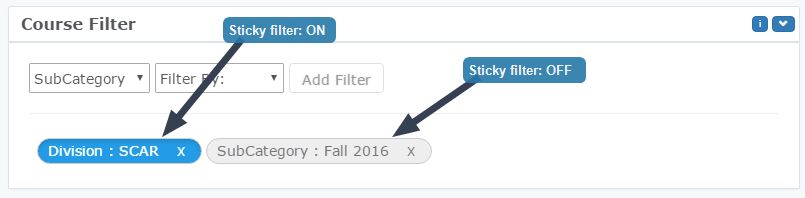
Sticky filters
With problem areas identified and action taken, set sticky filters to quickly refocus the Response Rate Monitor on the subjects identified previously. For example, actions were taken to improve the response rates on a struggling department which can now be viewed every time the response rate monitor is opened by quickly toggling the sticky filter.
Filters may provide unpredictable results if a subject is involved in multiple projects and those projects are assigned different categories or subcategories. In this situation regardless of the filters being applied, it is not possible to display the subject response data for only one of the projects.
Response Analytics
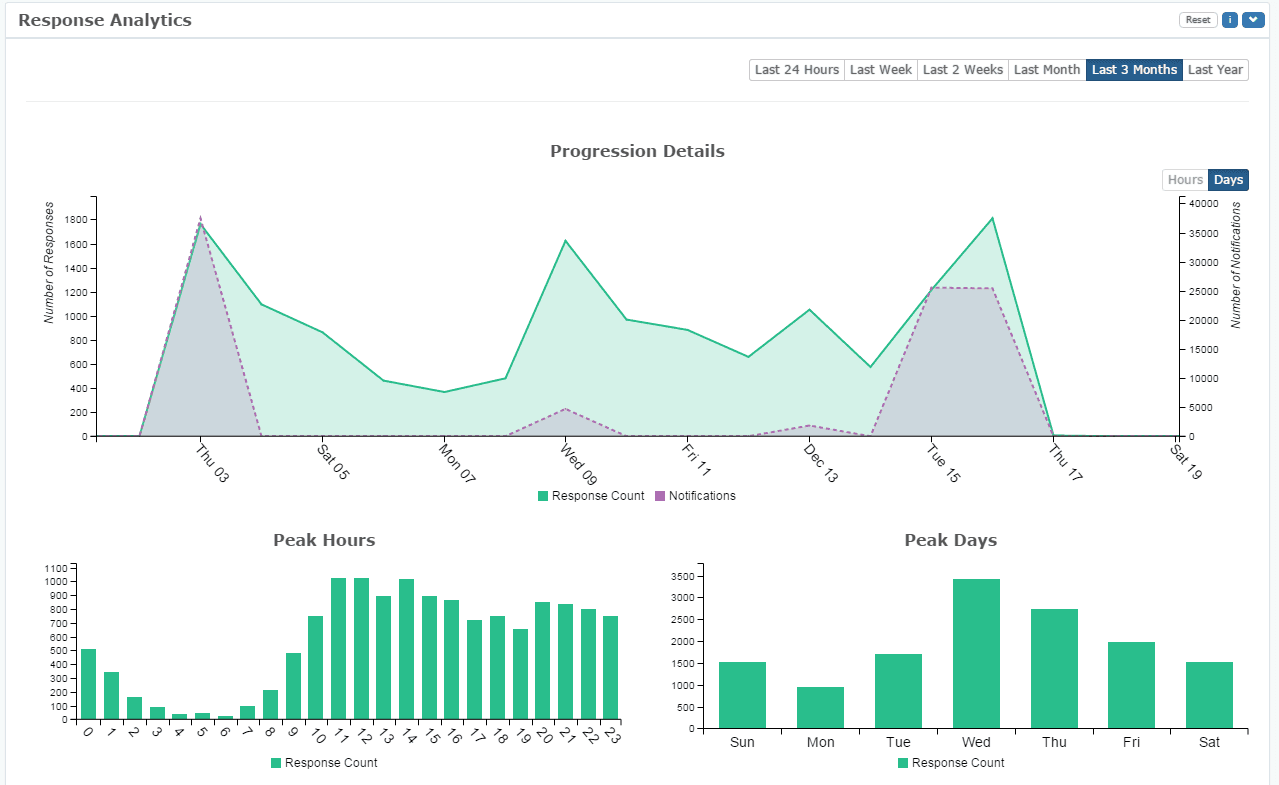
Learn more about the what, when, where and how raters are responding. Spot trends by selecting a segment of any of the Response Analytics charts and the other charts will update automatically and display just the data from the highlighted segment.
Response Analytics contains the following:
- Progression Details - a comparison of the number of responses versus the number of notifications over time.
- Peak Hours - the time of the day that a response was submitted.
- Peak Days - the day of the week that a response was submitted.
- Channels - the link source that respondents are using to access the questionnaire (fillout task). The link source includes:
- Email, Blue home, QR code, SMS, Thank you page, API, portal - pop-up, portal - course link, portal - grade blocking, portal - course blocking, or undetermined (from an unknown source)
- If the pop-up includes a link to the task list page instead of the fillout task itself, it may be included in the "Undetermined" channel.
- Browsers - the web browsers used to submit the responses.
- Operating System - the operating system that was in use by the user when they submitted the response.
- Location - the physical location of the user when they submitted their responses according to their IP address. Learn how to Customize the Response Analytics Captions .
Leverage Response Analytics to ensure that improvement actions make the most impact. Use the Progression Details to find correlations between responses received and notifications sent. Adjust the chart to view daily, weekly, and monthly response data.
Use the Reset button in the title bar of each widget to remove any customizations that have been applied.
Strive to know the answer to the question "How do notifications affect response rates?". Ideally, clear correlations between when notifications are sent and the effect that has on response rates can be spotted and taken advantage of.
Fine tune actions further by determining which days of the week and which hours of the day receive the most responses. By carefully timing notifications, deadlines and other actions, your efforts will have more impact, which will ultimately result in higher response rates.
Additional Response Tracking Analytics can also provide some insightful information that can ensure the message is being received on the right operating system, through the right medium and in the right place. Learn more about how to Enable analytics data collection.
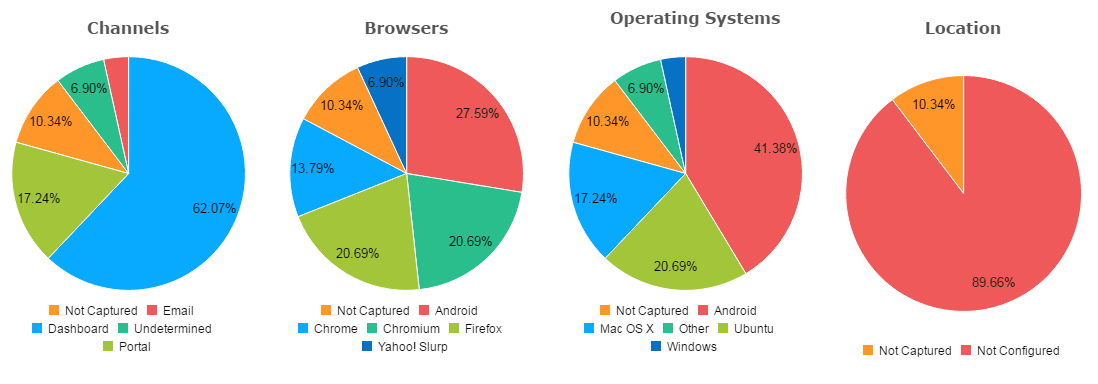
Due to size restrictions, labels are not included for segments of the pie chart that amount to less than 5% of the total.