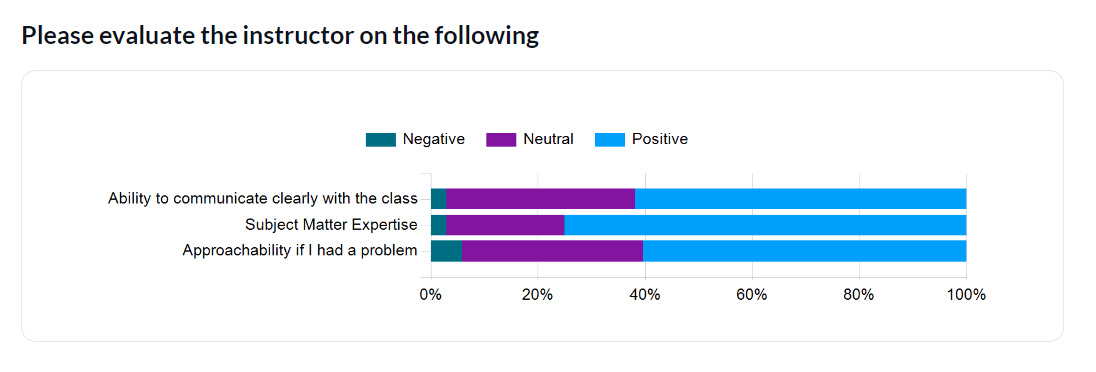
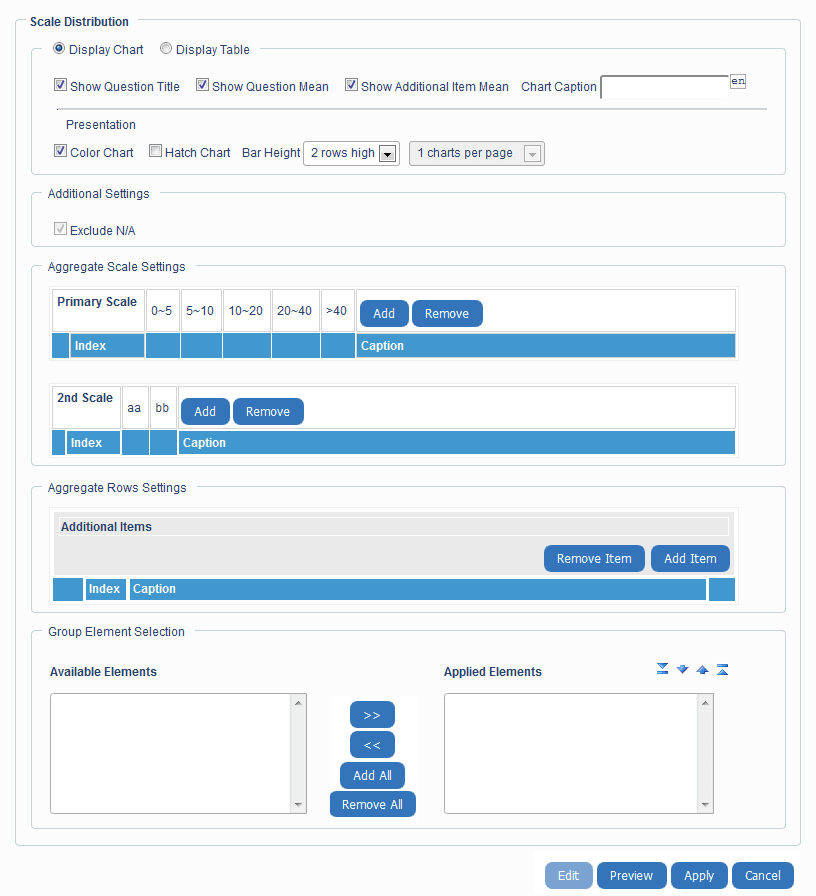
Scale distribution report block
Display the frequency of each response for a question with the option of creating aggregate frequencies based on:
- combined rating scale points (i.e.: all those ‘in agreement’, having rated 4 and 5 on a 5 point scale)
- consolidated rating questions frequency (i.e.: all those who answered questions 1 and 3 only)
- ranges of numeric responses (i.e.: all those who have answered between 50 and 100 percent)
- net promoter score (i.e.: all of the identified positive responses on a rating scale in a five point Likert scale 3, 4, and 5 may be considered positive.
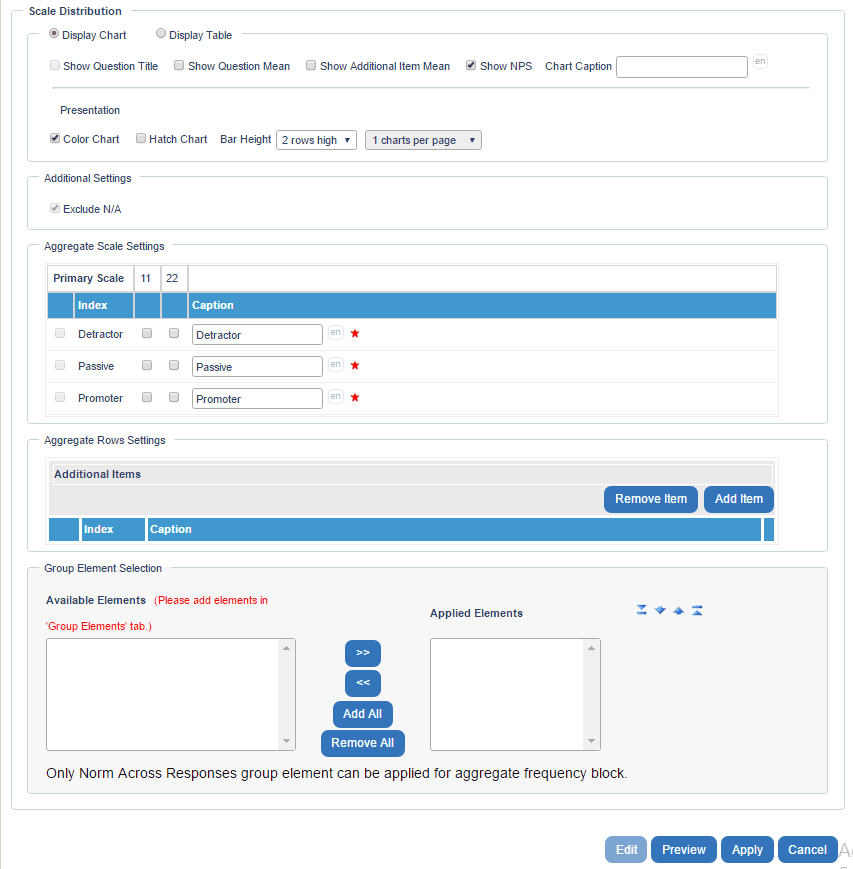
- Display Chart
- Show Question Title - display the full question label as you defined it in the questionnaire. If this box is not checked then the questions will simply be enumerated (question 1, question 2, question 3, etc.).
- Show Question Mean - display the mean (average) for each question.
- Show Additional Item Mean - display the mean (average) for each additional item.
- Show NPS 1 - NPS is an index generated by applying the formula: (Promoters - Detractors) / (total number of survey respondents)](#) - display the Net Promoter Score (NPS), which is a calculated value between the promoters (percent positive rating) and the detractors (percent negative rating) for a question, the NPS should always be displayed with the chart and the table (two separate blocks).
- Chart Caption - add a label to the graph chart.
- Color, Hatch - options to display bar charts in color and/or with a hatch pattern.
- Bar Height - Select how thick the individual frequency bars will be displayed. This directly impacts how the corresponding question label is wrapped; if ‘1 row high’, the entire text will be displayed on a single line per bar, if ‘5 rows high’, longer text can be comfortably wrapped alongside the frequency bar.
- Charts Per Page - Select the number of charts. When you select the number of charts per page, for a multi-page Report Block, the Report Block title, description, and the word “continued” will appear on the second and following pages of the report.
- Display Table
- Columns Per Table - number of columns displayed, maximum ten.
- Tables Per Page - number of tables displayed, maximum ten.
- Additional Settings -
- Exclude N/A - do not display ‘Not Applicable’ responses in the report
- Aggregate Scale Settings
- Primary Scale - Click the Add button select which scale point to include in the frequency analysis. Multiple aggregate frequency scale points will be displayed in a stacked chart format. The Remove button is used to exclude scale points from the question block.
- Select the Scale - Check to display specific scale points or questions. For instance, only calculate the frequency based on positive feedback received, such as those who said ‘Exceeds expectations’ and ‘Greatly exceeds expectations’.
- Caption - Enter text to label the scale point’s frequency analysis in the chart or table.
- Secondary Scale - Click the Add button select which scale point to include in the frequency analysis. Multiple aggregate frequency scale points will be displayed in a stacked chart format. The Remove button is used to exclude scale points from the question block.
- Select the Scale - Check to display specific scale points or questions. For instance, only calculate the frequency based on positive feedback received, such as those who said ‘Exceeds expectations’ and ‘Greatly exceeds expectations’.
- Caption - Enter text to label the scale point’s frequency analysis in the chart or table.
- Primary Scale - Click the Add button select which scale point to include in the frequency analysis. Multiple aggregate frequency scale points will be displayed in a stacked chart format. The Remove button is used to exclude scale points from the question block.
- Aggregate Rows Settings
- Additional Items - Each question’s frequency bar is automatically displayed. Add items to combine select questions into meaningful frequency analysis and/or add them all for an overall analysis of the selected scale points.
- Add Item - Click the Add Item button to include an additional question. Enter a Caption for this new bar. By default, all the questions will be checked for an overall frequency analysis. Click the Edit link to modify the question list and click Apply when done.
- Remove Item - Click the Remove Item button to remove the selected additional item.
- Additional Items - Each question’s frequency bar is automatically displayed. Add items to combine select questions into meaningful frequency analysis and/or add them all for an overall analysis of the selected scale points.
- Group Element Selection - By default, each rating question will be displayed as a singular score represented by the sum of all raters divided by the total. This display mode will be used when the Chart elements box is empty.
If you have created any elements (in Content - Group Elements), you can add them or remove them here. Adding a group element will display it in your report.
Footnotes
- NPS is an index generated by applying the formula: (Promoters - Detractors) / (total number of survey respondents) ↩
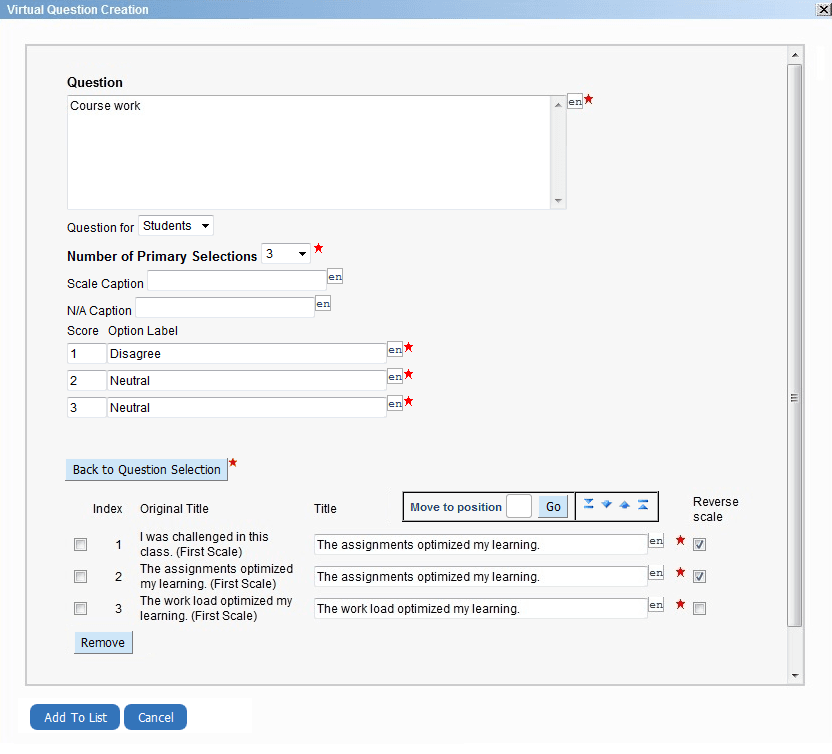
Reports cannot be generated if the Question - Scale Distribution report block contains any virtual questions that contain duplicates in the Option Label or duplicates in the Title as shown:
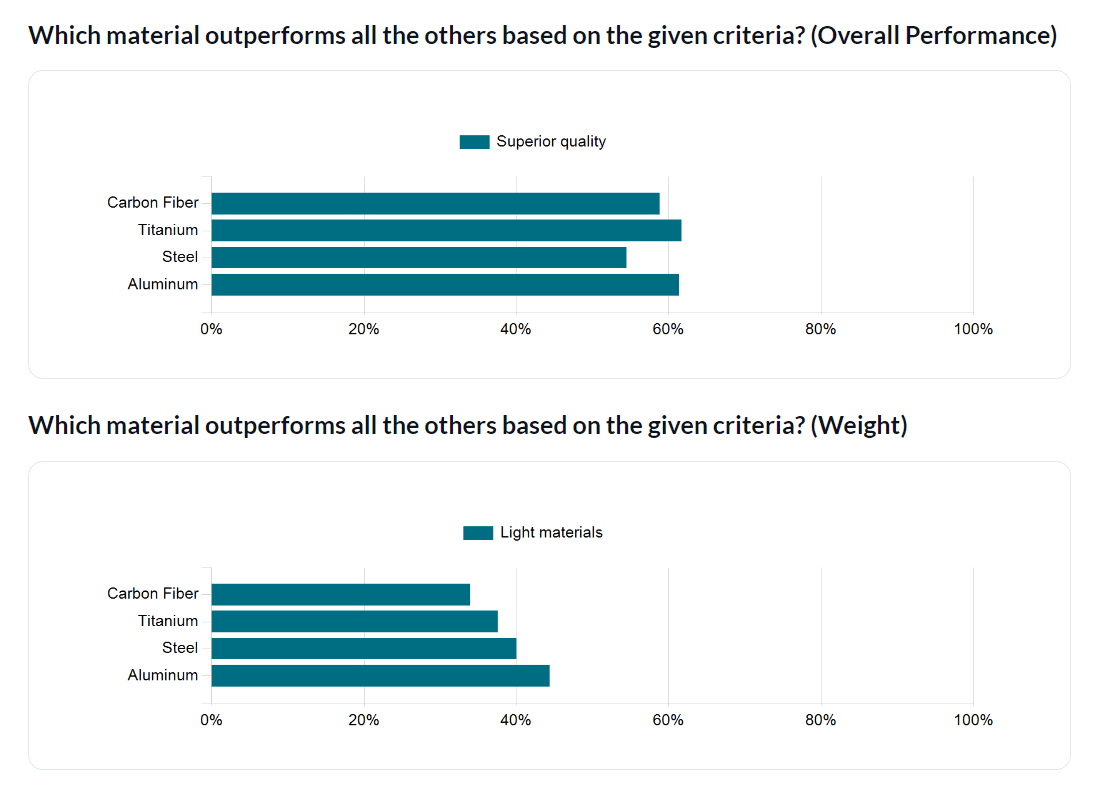
Question - Scale Distribution using two scales
If a question uses two scales, the report block can display two charts, one for each scale (1st Scale and 2nd Scale), or it can display a combined chart that contains both scales (Dual Scale). The second scale is only displayed if 2nd Scale or Dual Scale is enabled.
Select options for scale 1 and other options for scale 2. Only selected options will be used to calculate the report block results. Additional 2nd Scale points may be added or removed by clicking the Add or Remove buttons. By default, Blue enters numbered aggregates for the Caption title. Modify these according to your preference.
The report will show two report blocks: one block for scale one, and another block for scale two.