Spreadsheet report block
The Question - Spreadsheet report block allows multiple statistics to be displayed in one compact table. Many of the statistics found in different report blocks can all be included in the spreadsheet block.
- Rollover reports do not support Question - Spreadsheet report blocks.
- Only Breakdown by field, Norm across responses, and Norm across subjects group elements are supported.
- Only one rater group can be assigned to each Norm across responses or Norm across subjects group element used in the spreadsheet report block.
- Spreadsheet blocks are not supported in reports based on typical or simplified surveys.
- Only available for Single Selection, Single Selection Table, Multiple Selection, and Multiple Selection Table questions.
- Multiple Selection and Multiple Selection Table questions only support frequency calculations.
- Either the 1st scale or the 2nd scale can be displayed for Single Selection and Single Selection Table questions.
- Demographics data for both the primary and secondary subject can be displayed.
- The spreadsheet block will only display data from the primary project when used with project mapping. The data from the auxiliary projects will not be included.
Here's a short description of each of the options available in a Question - Spreadsheet report block.
Display
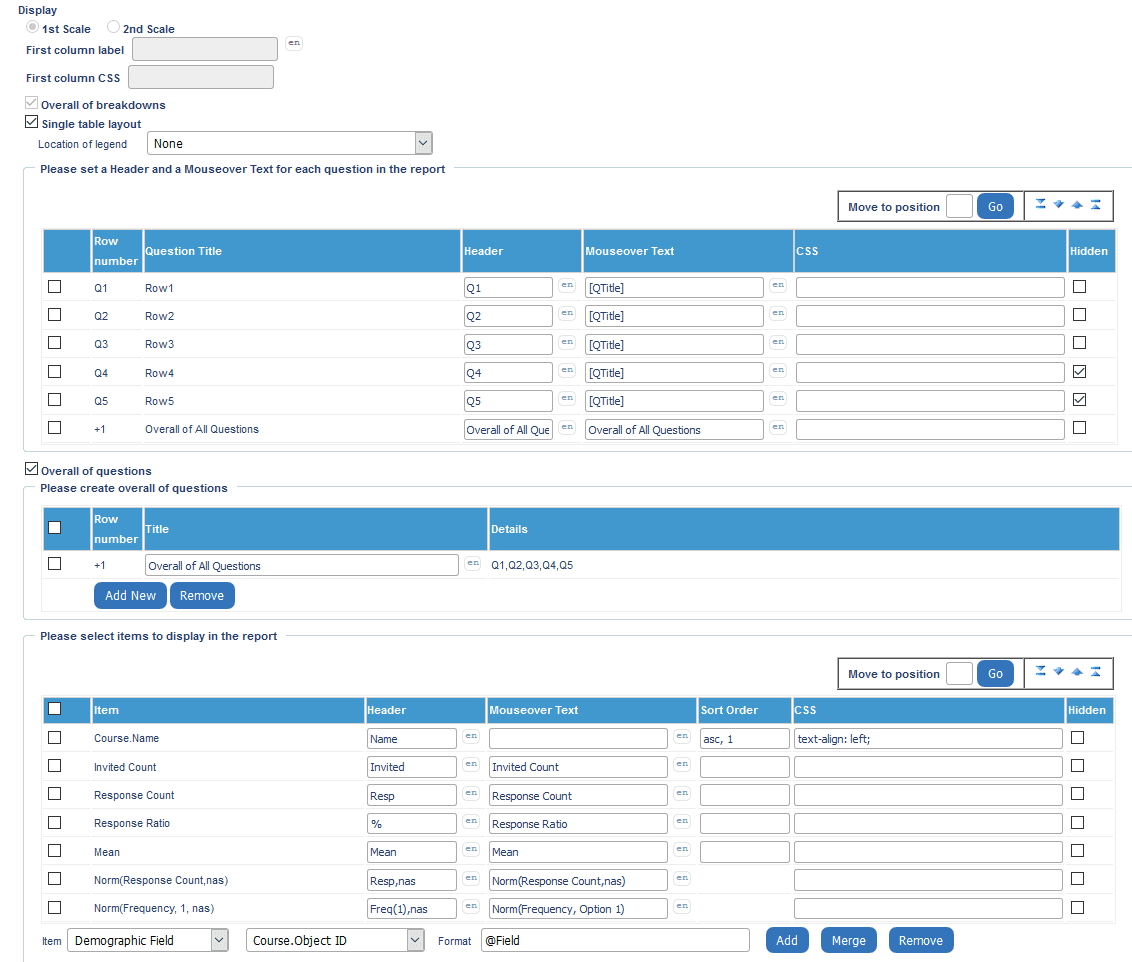
- 1st Scale or 2nd Scale - if a question has more than one scale, the spreadsheet block can report on only one at a time.
- First column label - the first row and column is usually left empty in a spreadsheet. This label allows to add text to this column / row.
- First column CSS - fully customize the display look of the first column with custom CSS. Separate CSS values with a semicolon.
- Overall of breakdowns - Enabled by default. When a breakdown by field group element is applied, an additional option is available providing the choice to calculate the overall mean by responses or by row.
Single Table Layout
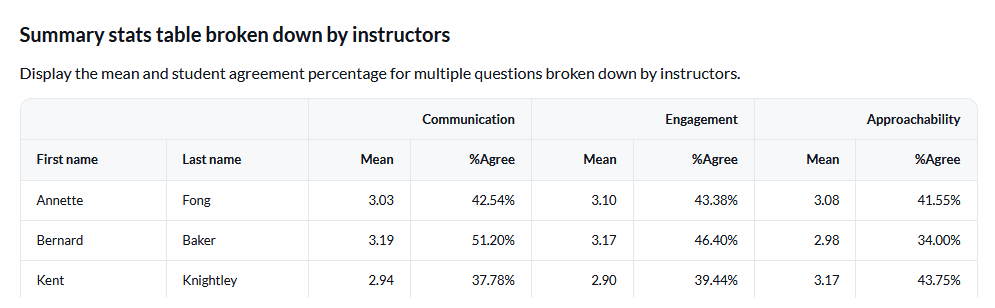
When enabled, multiple questions can be included in a single table, questions are added as columns with any included statistics appearing as sub columns for each question. This may cause the table to become extraordinarily wide.
The Single Table Layout option is only available for Single Selection Table questions.
When Single Table Layout is enabled, a number of other options become available:
- Location of legend - choose the location of the question legend which will contain the full text of the selected questions.
- Question Table - lists the questions that will be included in the spreadsheet block, if a question is marked as hidden it will not appear in the spreadsheet report block and it will not be included in calculations.
Overall of questions
Combine the responses from multiple questions to be reported on as a whole.
- Multiple overall of questions items can be added to the same table.
- The sort order does not apply to the multiple overall of questions.
- When using the Single Table Layout, their position can be changed.
- Display an overall of questions in the Single Table Layout without the questions that make them up by using the Hidden feature.
- The overall of questions feature is similar to a virtual question but limited to the spreadsheet block.
Because not all statistics can be applied to overall questions, use the following table to identify those applicable.
| Spreadsheet item | Overall calculation type |
|---|---|
| Frequency | Sum of frequency counts across questions (i.e. overall frequency counts) |
| Response Count | Sum of response counts across questions (i.e. overall response counts) |
| Frequency Percentage | Ratio: Overall Frequency Counts / Overall Response Counts |
| Norm - Response Count | Sum of response counts across questions in a comparison group ("group element") |
| Invited Count | Sum of invited counts across questions (i.e. overall invited counts) |
| Response Ratio | Ratio: Overall Response Counts / Overall Invited Counts |
| Mean | Average of means across questions |
| Sum Total Score | Sum of total scores across questions |
| Minimum Response Score | N/A1 |
| Maximum Response Score | N/A1 |
| Mode | N/A1 |
| Median | N/A1 |
| Interpolated Median | N/A1 |
| Semi-Interquartile Range | N/A1 |
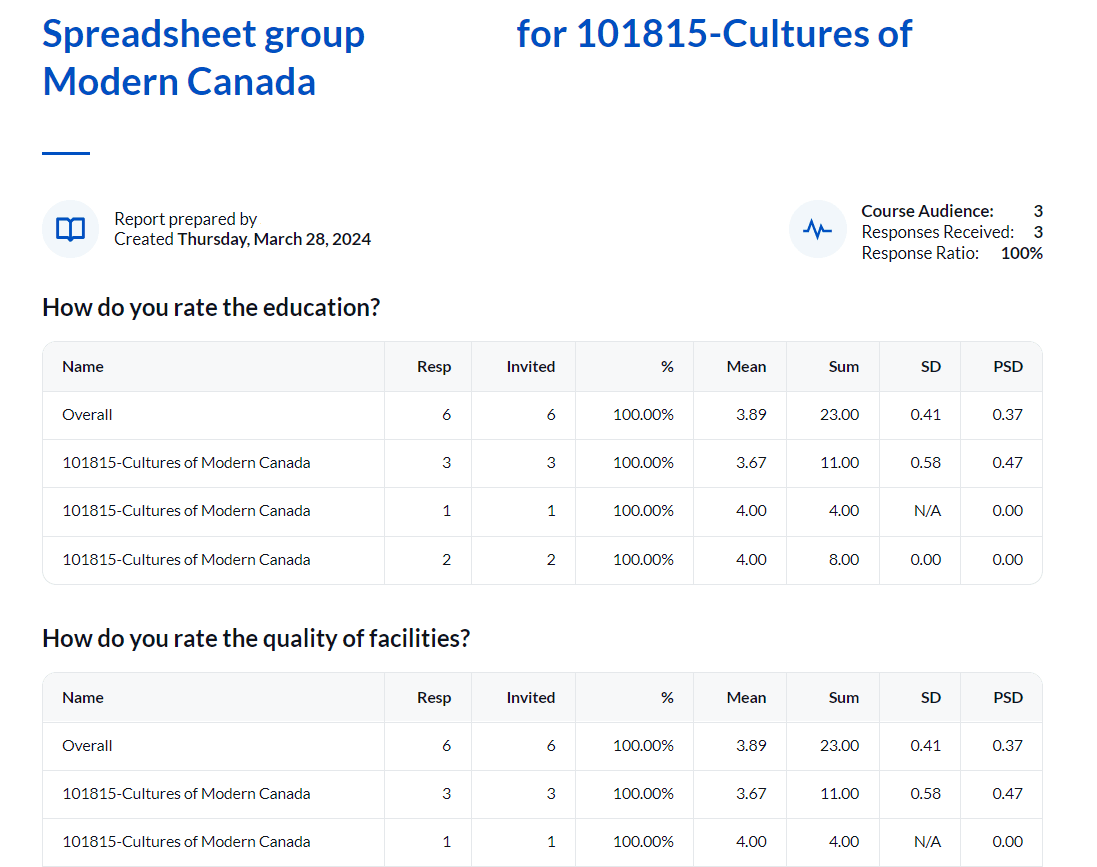
| Standard Deviation (SD) | Standard Deviation (SD) is an indication of how wide a range of answers there were. A low SD means there was a lot of agreement about the answers. A high SD means there was a wide range of answers, indicating disagreement. |
| Standard Error based on SD | N/A1 |
| Population Standard Deviation (PSD) | Population standard deviation (PSD) is same as standard deviation but the only difference is that, standard deviation is calculated for a sample whereas population standard deviation is calculated for the whole population. |
| Standard Error based on PSD | N/A1 |
| Percentile | N/A |
| Percentile Rank | N/A |
| Dispersion Index - Ordinal | N/A1 |
Footnotes
The formulas of the statistical calculations that are used in the Report Block, can be found in How does Blue calculate measures of central tendency? and How does Blue calculate measures of dispersion?.
Items to Display Table
Lists the statistics and demographic data that will be displayed for each subject. Within this table the Header and mouseover text can be customized, sort order can be set, custom inline CSS styles can be applied, and items can be hidden from the final report.
To add statistics to the Items to display table:
- Select a statistic or demographic field from the drop-down list. Items include:
- Demographic field
- Response count
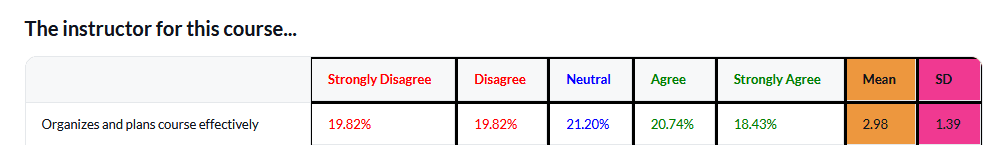
- Frequency
- Frequency percentage
- Mean
- Sum total score
- Minimum response score
- Maximum response score
- Mode
- Median
- Interpolated median
- Semi-interquartile range
- Standard deviation (SD)
- Standard error based on SD
- Population standard deviation (PSD)
- Standard error based on PSD
- Percentile
- Percentile (the method used by Microsoft Excel)
- Nearest Rank
- Linear Interpolation
- Percentile rank
- Norm
- Response count
- Mean
- Standard deviation (SD)
- Median
- Interpolated median
- Percentile
- Frequency - only supports norm across responses group elements
- Frequency percentage - only supports norm across responses group elements
- Adjust the Format if necessary, _@field_ will cause the contents of the field to be displayed, it can be prepended or appended by additional text if necessary. For example, certain data may represent money so the Format field can be changed to to _$@field_ to include a dollar sign before the contents of the field. This can be especially useful when merging demographic fields together.
- Modify the Header with plain text only as necessary to describe what the data in the column represents.
- Modify the Mouseover text with plain text only as necessary to add more detail about the information in the column.

- Set the Sort order by entering either asc for ascending or desc for descending sort order followed by a comma, a space, and a number that represents which column is sorted first, second, third, etc. See examples:
asc, 1
desc, 2
Only demographics and breakdown fields are affected by the specified sort order.
- Add in-line styles with custom CSS to enhance the look and feel of the information displayed in the report. Separate styles using a semicolon. Styles are applied to all rows in the column including the header. See the following example:
- Mark a column of data as Hidden so that it does not appear in the report, but it is still available for sorting purposes.
- Choose to merge multiple demographic fields together by first selecting them, then clicking Merge. This may be useful for displaying a person's first and last name, phone number with extension, etc.
Group Elements
Apply either Breakdown by field or Norm across responses group elements to affect the how the spreadsheet report block organizes the selected statistics.
By default, Question - Spreadsheet displays an aggregate value based on the subjects included in the group by report. By including the Breakdown by field group element, the report manager can select a field from a datasource and the spreadsheet block will present information according to that breakdown.