How does Blue calculate measures of central tendency?
In statistics, a central tendency (or a measure of central tendency) is a value that attempts to describe a set of data by identifying the central position within that set of data. The mean (often referred to as the average) is a common measure of central tendency that you may be familiar with, but there are others, such as the median, the interpolated median, and the mode.
The central tendency of a distribution is typically contrasted with its dispersion or variability (How does Blue calculate measures of dispersion?); dispersion and central tendency are the often characterized properties of distributions. Analysts may judge whether data has a strong or a weak central tendency based on its dispersion.
The mean, median and mode are all valid measures of central tendency, but under different conditions, some measures of central tendency become more appropriate to use than others.
- When you have a normally distributed sample, you can legitimately use both the mean or the median as your measure of central tendency. The mean, median and mode are equal in any symmetrical distribution.
- However, when data is skewed, the mean is being dragged in the direct of the skew. In these situations, the median is generally considered to be the best representative of the central location of the data. The more skewed the distribution, the greater the difference between the median and mean, and the greater emphasis should be placed on using the median as opposed to the mean.
- If the data is non-normal, it is customary to use the median instead of the mean. However, this is more a rule of thumb than a strict guideline. Sometimes, analysts wish to report the mean of a skewed distribution if the median and mean are not appreciably different (a subjective assessment), and if it allows easier comparisons to previous research to be made.
Blue calculations
Mean
One of the most common measures of central tendency is the mean or average. In Blue, it is calculated by adding up the scores of the responses and dividing the sum by the number of responses. For example, the mean for the following set of responses 3,4,6,6,7 would be calculated as:

Median
The median is the middle value of an ordered list of responses. In the example above, the median value would be 6. The median value for an even set of values is found by calculating the average of the central two numbers.
Interpolated Median
The interpolated median provides another measure of centre, which takes into account the percentage of the data that is strictly below versus strictly above the median. The interpolated median (IM) adjusts the median slightly upward or downward, depending on whether the distribution is more heavily weighted above or below the median (i.e., in the direction that the data is more heavily weighted), by weighing the responses using the following formula where  = median,
  = number of scores less than
  ,
,  = number of scores equal to
  , and
, and  = number of responses greater than
  .
.
If  then:
then:

For example the interpolated median of 3,4,6,6,7 = 6 (1-2)/ (2*2)=5.75
If  then:
then:

Blue calculates the interpolated median using two equivalent formulas, primarily as a way to improve efficiency since we are already aware of the value of  :
:


where  = total responses,
For more information about interpolated median, see the following:
- The Interpolated Median, Administration Evaluation, University of Michigan (http://aec.eecs.umich.edu/median.php)
- Murray, James M, PhD. (2018) Median and Interpolated Median (https://murraylax.org/rtutorials/medians.pdf)
Mode
Mode is simply the most frequent value in a set of responses. The mode for the example data we have been working with is 6 because it appears in the list twice, whereas the rest appear just once. If, in the set of data, none of the values appear more than once, then there is no mode for that set of data. If multiple values appear the most number of times, then there are multiple modes.
Available in Blue report blocks
Listed below are the measures of central tendency for the applicable question types:
Single Selection
- Question - Frequency
- Question - Score
- Question - Spreadsheet
Single Selection Table
- Question - Frequency
- Question - Score
- Question - Spreadsheet
Implementing in Blue reports
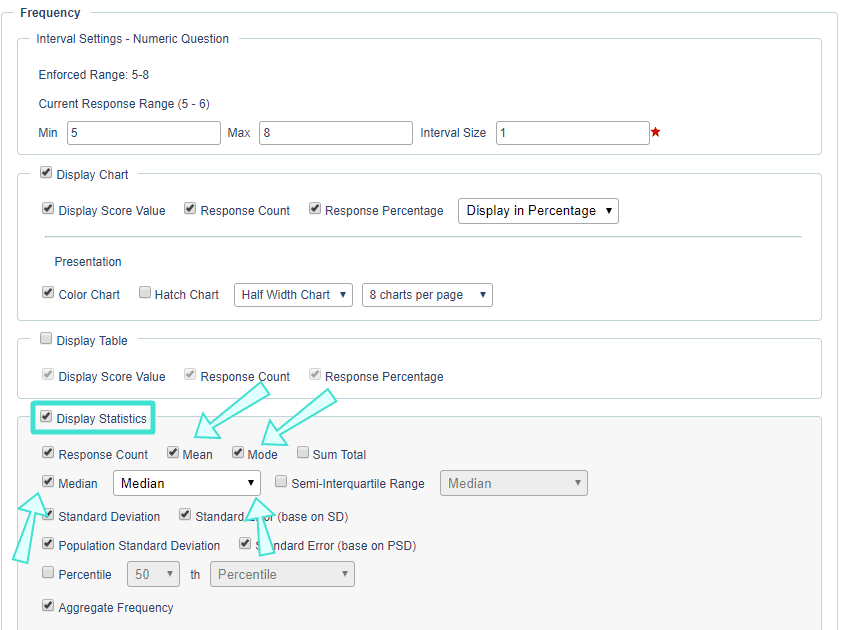
- In a Question - Frequency report block representing a Single Selection question, enable Display Statistics then select the mean, mode and median as desired. If including a median, choose either median or interpolated median from the drop-down list.
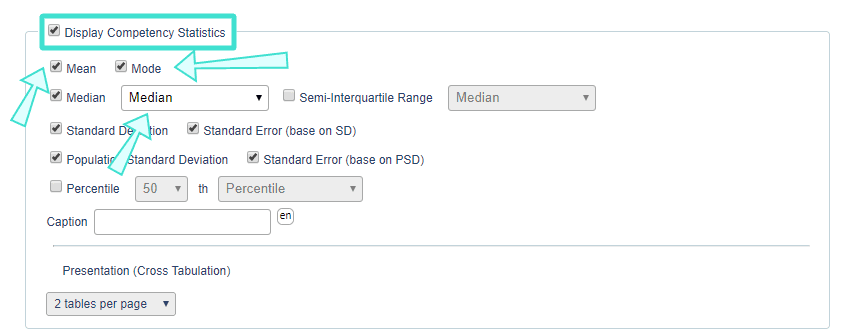
- In a Question - Frequency report block for a Single Selection Table, you can enable Display Competency Statistics to calculate statistics like the overall mean, mode, median or interpolated median for all the questions within the table.
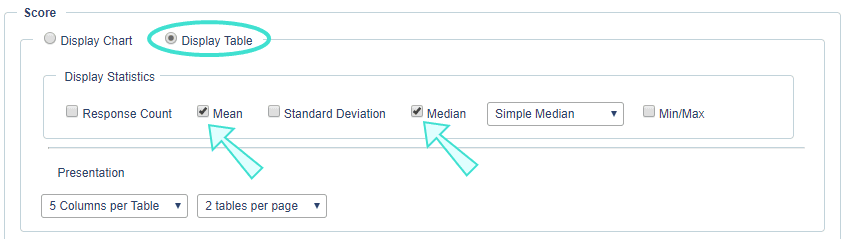
- For a Question - Score report block, you have to select Display Table then enable mean or median. If median is used, choose between Simple Median and Interpolated Median.
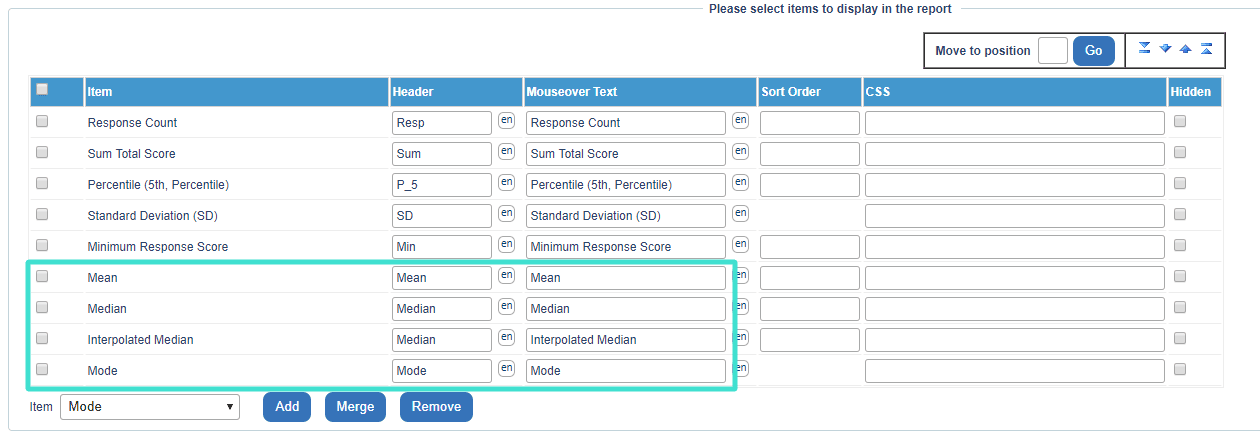
- For a Question - Spreadsheet report block you can include the mean, mode, median or interpolated median together in one block. To add statistics to the spreadsheet block, select the value from the Item drop-down list and the select Add .
Recommendations
The challenge of reporting is choosing appropriate statistical measures for data. The following are recommendations for mitigating this problem:
- Use a Question - Frequency block to show the distribution of the responses, and display the mean, mode, and median
- Use a Question - Score or a Question - Spreadsheet block to display the measures of central tendency and measures of dispersion relevant to your institution.
- If only using the mean, compare it to other means within the organization by using group elements for department, divisions, etc.
Average of rater groups
In Blue, the Average of multiple rater groups combines these multiple groups first and then calculates the mean of the combined population.
The exception is a score block for those who are interested in average of averages of rater groups. In Question - Score report blocks, Average of rater groups creates the mean, by calculating the mean for each rater group, then calculating the overall mean by taking the mean of the means.
Is the average of the averages equal to the average of all the numbers originally averaged?
The correct answer is that it depends. The average of averages is only equal to the average of all values in two cases:
- If the number of elements of all groups is the same
- The trivial case when all the group averages are zero
In the first case, consider two sets  and
and 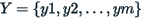 and their averages. The following reasoning can be extended for any number of groups.
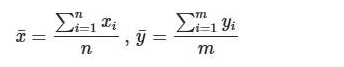
The average of the averages is:
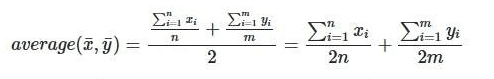
Now consider the whole group:  and its average:
For the general case, we can see that these averages are different:
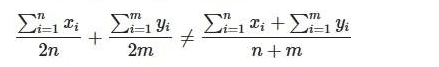
However, if we make  then, we have:
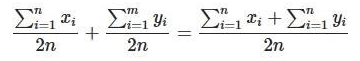
This is why the average of averages is equal to the average of the whole group when the groups have the same size.
The second case is trivial: 
While the average of the averages (supported with the average of rater groups in the Blue Question - Score report block is not wrong, it needs careful statistical interpretation (mindful of a paradox such as Simpson’s paradox - “The practical significance of Simpson's paradox surfaces in decision making situations where it poses the following dilemma: Which data should we consult in choosing an action, the aggregated or the partitioned?”).