How does Blue calculate measures of dispersion?
The measures of central tendency are not adequate to describe data. Two data sets can have the same mean but they can be entirely different. Thus to describe data, one needs to know the extent of variability. This is given by the measures of dispersion. Variability and spread are synonyms for dispersion.
Summary of common measures of dispersion
There are many measures of dispersion. Standard deviation, interquartile range, and semi-interquartile range are the three most commonly used measures of dispersion, but several others are available in Blue.
- The standard deviation
- By far the most widely used measure of spread. It takes every score into account, has useful properties when used with a normal distribution, and is tractable mathematically and, therefore, it appears in many formulas in inferential statistics.
- Measures the amount of variability, or the dispersion, of data in a normal distribution. The (sample) standard deviation indicates how accurately the mean represents sample data.
The (sample) standard deviation is not a good measure of spread in highly-skewed distributions, and should be supplemented in those cases by the semi-interquartile range.
- Standard error of the mean
- Measures how far the sample mean of the data is likely to be from the true population mean.
- Is always smaller than the sample standard deviation.
- The Interquartile range
- If the interquartile range is large it means that the middle 50% of observations are spaced wide apart.
- The important advantage of interquartile range is that it can be used as a measure of dispersion if the extreme values are not being recorded exactly (as in case of open-ended class intervals in the frequency distribution), nor is it affected by extreme values.
- The main disadvantage in using interquartile range as a measure of dispersion is that it is not amenable to mathematical manipulation.
- Semi-interquartile range
- In a symmetric distribution, an interval stretching from one semi-interquartile range below the median to one semi-interquartile above the median will contain 1/2 of the scores. This will not be true for a skewed distribution, however.
- The semi-interquartile range is rarely used as a measure of dispersion, in part because it is not very mathematically tractable. The semi-interquartile range is less influenced by extreme scores, however, so it is a good measure of dispersion for skewed distributions and has a good intuitive meaning. Note that semi-interquartile range is more subject to sampling fluctuation in normal distributions than is the standard deviation, and therefore not often used for data that are approximately normally distributed.
- It should be used to supplement the standard deviation in most cases.
- Sample standard deviation from population standard deviation
- We are normally interested in knowing the population standard deviation because our population contains all the values we are interested in. Therefore, you would normally calculate the population standard deviation if you have the entire population
- When presented with data from a sample only, one can estimate the population standard deviation from a sample standard deviation.
- However, if all you have is a sample, but you wish to make a statement about the population standard deviation from which the sample is drawn, you need to use the sample standard deviation.
- Confusion can often arise as to which standard deviation to use due to the name "sample" standard deviation incorrectly being interpreted as meaning the standard deviation of the sample itself and not the estimate of the population standard deviation based on the sample.
Blue calculations
Sample Standard Deviation (SD)
The formula for the sample standard deviation is:
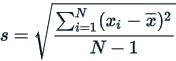
where  are the observed values of the sample items,
  is the mean value of these observations, and N is the number of observations in the sample.
Standard Error of the Sample mean
The standard error of the sample mean is usually estimated as the sample standard deviation divided by the square root of the sample size (assuming statistical independence of the values in the sample):

where:
 is the sample standard deviation (i.e., the sample-based estimate of the standard deviation of the population).
 is the size (number of observations) of the sample.
Population Standard Deviation (PSD)
The formula for the population standard deviation is:
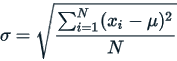
where  are the observed values of the items,
  is the mean value of these observations and N is the number of observations.
Standard Error of the Population Mean
The standard error of the population mean is usually estimated as the population standard deviation divided by the square root of the population:

where:
 is the population standard deviation of the population
 is the size (number of observations) of the population.
Interquartile Range
In a set of data, the quartiles are the values that divide the data into four equal parts. Interquartile range is defined as the difference between the 25th and 75th percentile (also called the first and third quartile). Hence the interquartile range describes the middle 50% of observations.
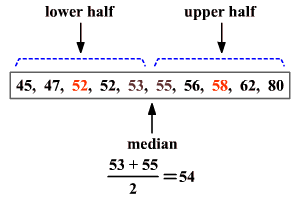
The median of the lower half of a set of data is the lower quartile (LQLQ) or Q1Q1 .
The median of the upper half of a set of data is the upper quartile (UQUQ) or Q3Q3 .
The upper and lower quartiles can be used to find another measure of variation called the interquartile range.
The interquartile range or IQR is the range of the middle half of a set of data. It is the difference between the upper quartile and the lower quartile.

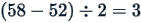
In the above example, the lower quartile is 52 and the upper quartile is 58. Thus,
The interquartile range is:

Semi-interquartile range
Statisticians sometimes also use the terms semi-interquartile range and mid-quartile range .
The semi-interquartile range is one-half the difference between the first and third quartiles. It is half the distance needed to cover half the scores. The semi-interquartile range is affected very little by extreme scores. This makes it a good measure of spread for skewed distributions. It is obtained by evaluating:

The semi-interquartile range is:
Percentile Rank
The percentile rank of a score is the percentage of scores in its frequency distribution that are equal to or lower than this score. For example, a rating score that is greater than or equal to 75% of the scores of courses in a course evaluation is said to be at the 75th percentile.
Percentile ranks are not on an equal-interval scale, meaning that, the difference between any two scores is not the same between any other two scores whose difference in percentile ranks is the same. For example, 50 − 25 = 25 is not the same distance as 60 − 35 = 25 because of the bell-curve shape of the distribution. Some percentile ranks are closer to some than others. Percentile rank 30 is closer on the bell curve to 40 than it is to 20. Essentially we can't draw any correlation between score and percentile rank.
The mathematical formula is:
Where  is the count of all scores less than the score of interest,
  is the frequency of the score of interest, and
  is the number of examinees in the sample.
Percentile Range
A percentile range is the difference between two specified percentiles. These could theoretically be any two percentiles, but the 10-90 percentile range is the most common. To find the 10-90 percentile range:
- Calculate the 10th percentile
- Calculate the 90th percentile
- Subtract Step 1 (the 10th percentile) from Step 2 (the 90th percentile).
Available in Blue report blocks
Listed below are the measures of dispersion for the applicable question types:
Single Selection
- Question - Frequency
- Question - Score
- Question - Spreadsheet
Single Selection Table
- Question - Frequency
- Question - Score
- Question - Spreadsheet
Implementing in Blue reports
When the caption "standard deviation" is encountered in the Blue interface it is referring to the sample standard deviation. In areas where the population standard deviation is being calculated, the interface explicitly refers to it as the "population standard deviation".
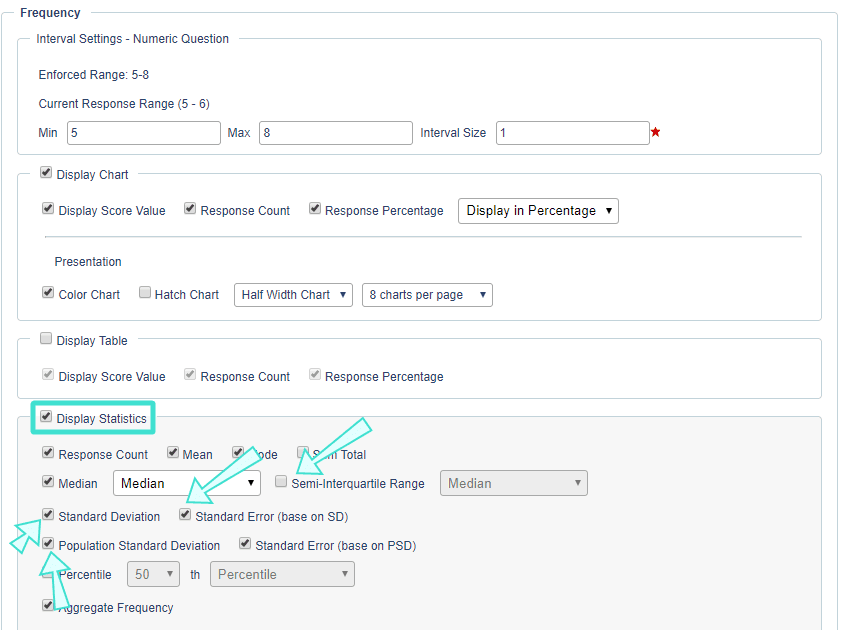
- In a Question - Frequency report block representing a Single Selection question, enable Display Statistics then select the (sample) standard deviation, standard error and semi-interquartile range as desired.
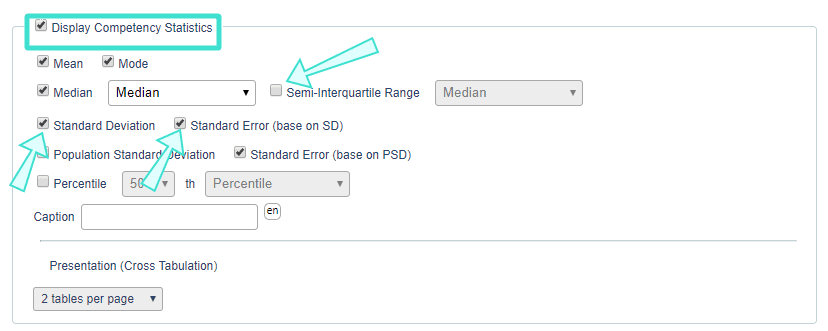
- In a Question - Frequency report block for a Single Selection Table, you can enable Display Competency Statistics to calculate statistics like the (sample) standard deviation, standard error, and the semi-interquartile range for all the questions within the table.
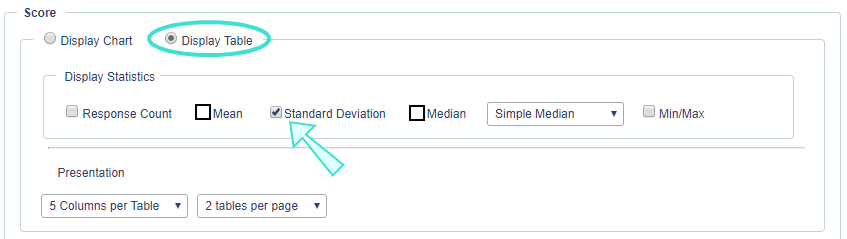
- For a Question - Score report block, you have to select Display Table then enable mean or median. If median is used, choose between Simple Median and Interpolated Median.
- For a Question - Spreadsheet report block you can include the mean, mode, median or interpolated median together in one block. To add statistics to the spreadsheet block, select the value from the Item drop-down list and the select Add .
Recommendations
The challenge of reporting is choosing appropriate statistical measures for data. The following are recommendations for mitigating this problem:
- Use a Question - Frequency report block to show the (sample) standard deviation.
- Use a Question - Spreadsheet report block to display the measures of central tendency and measures of dispersion relevant to your institution.