Score report block
Display results for a Single Selection or Single Selection Table question based on the project’s rater groups or the report’s Virtual Groups.
View some example score charts in action.
Display Chart/Table - Select whether to display the score analysis as a chart or as a table.
Chart
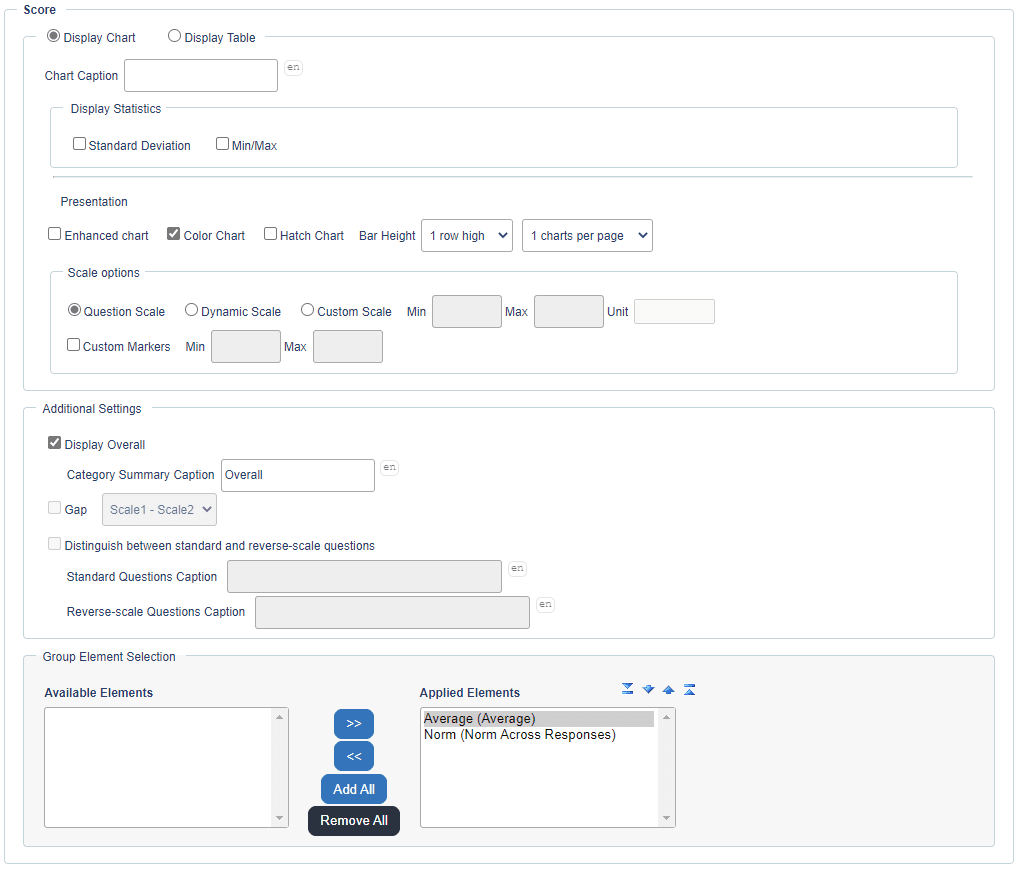
- Caption - Use this box to affix a label to the chart.
- Display Statistics - Check the appropriate option to display, when you have applied a chart element under Group Element Selection. Statistical markers are displayed on the chart as described below (uncheck the option to display the report block without these statistical markers):
- Standard deviation - this marker can be displayed for Breakdown by Rater Group, Rater Group Average and Norm (across Subjects and Responses) group elements only.
- Min/max - these markers can be displayed for Rater Group Score Average group elements only and will only be displayed for sub competencies. Additionally, when there is only one answer within a rater group (i.e.: Self), only the minimum and maximum markers will overlap
- Enhanced, Color, Hatch - Select the Enhanced, Color, or Hatch options to display bar charts in color and/or with a hatch pattern. The Enhanced chart display allows for different presentation of content (more compact)..
- Wrap Chart Label - Enable this option to allow the chart label to wrap. The bar height directly impacts how the corresponding question label is wrapped; if ‘1 row high’, the entire text will be displayed on a single line per bar, if ‘5 rows high’, longer text can be comfortably wrapped alongside the frequency bar.
- Bar Height - Select how thick the individual frequency bars will be displayed.
- Charts per page - Set page breaking within the report block itself to display between 1 and 20 charts per page.
When you select the number of charts per page, for a multi-page report block, the report block title, description, and the word “continued” will appear on the following pages of the report.
- Scale Options - Options to define the scale range displayed in charts.
- Question Scale (Default) - Scale range is taken from the project's question scales.
- Dynamic Scale - Scale range displayed in the chart is calculated based on the actual responses.
- Custom Scale - Users can input minimum and maximum scale ranges displayed in the chart.
- Custom Markers - Users can also select custom markers with a minimum/maximum range.
Table
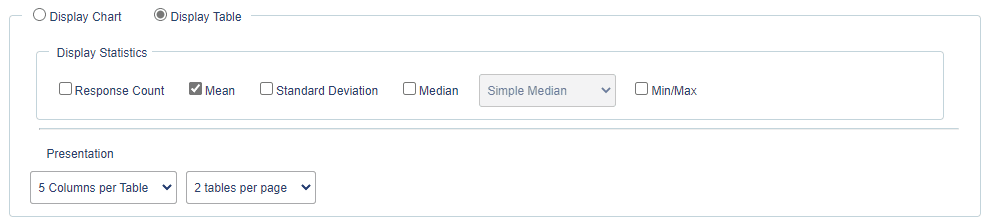
- Display Statistics - Check the appropriate option to display, when you have applied a table element under Group Element Selection. Statistical markers are displayed on the table as described below (uncheck the option to display the report block without these statistical markers):
- mean, median and response count
- minimum and maximum markers can be displayed on rater group score average groups only
- minimum and maximum markers can be displayed for sub competencies only
- when there is only one answer within a rater group (i.e.: Self), only the minimum and maximum markers will overlap
- a standard deviation marker can be displayed for Breakdown by Rater Group, Rater Group Average and Norm (across Subjects and Responses) only
- Presentation (Cross Tabulation) - Select the number of columns per table, and the number of tables per page.
Additional Settings
- Display Overall - Select whether overall data is displayed or hidden.
- Category Summary Caption - Affix a caption. You must apply a Group Element, or this box will be inactive.
- Gap
- Distinguish Between Standard and Reverse-Scale Questions - Check this option to display questions using a reverse-scale separately from standard questions; provide captions for standard question and reverse-scale question sections.
- Standard and Reverse Scale Question Caption - Use this box to affix a label.
Group Element Selection
By default, each rating question will be displayed as a singular score represented by the sum of all raters divided by the total. This display mode will be used when the Chart/Table Elements box is empty.
If any group elements (from the Group Elements page) have been created, they can be added here. For projects with multiple rater groups, chart elements are useful for displaying a breakdown by group of the results for each question.