Analyze response statistics
In BlueX, you can monitor the response rate of your survey, and export raw response data.
To monitor response data, go to your survey, and navigate to Survey management( ) - Responses.
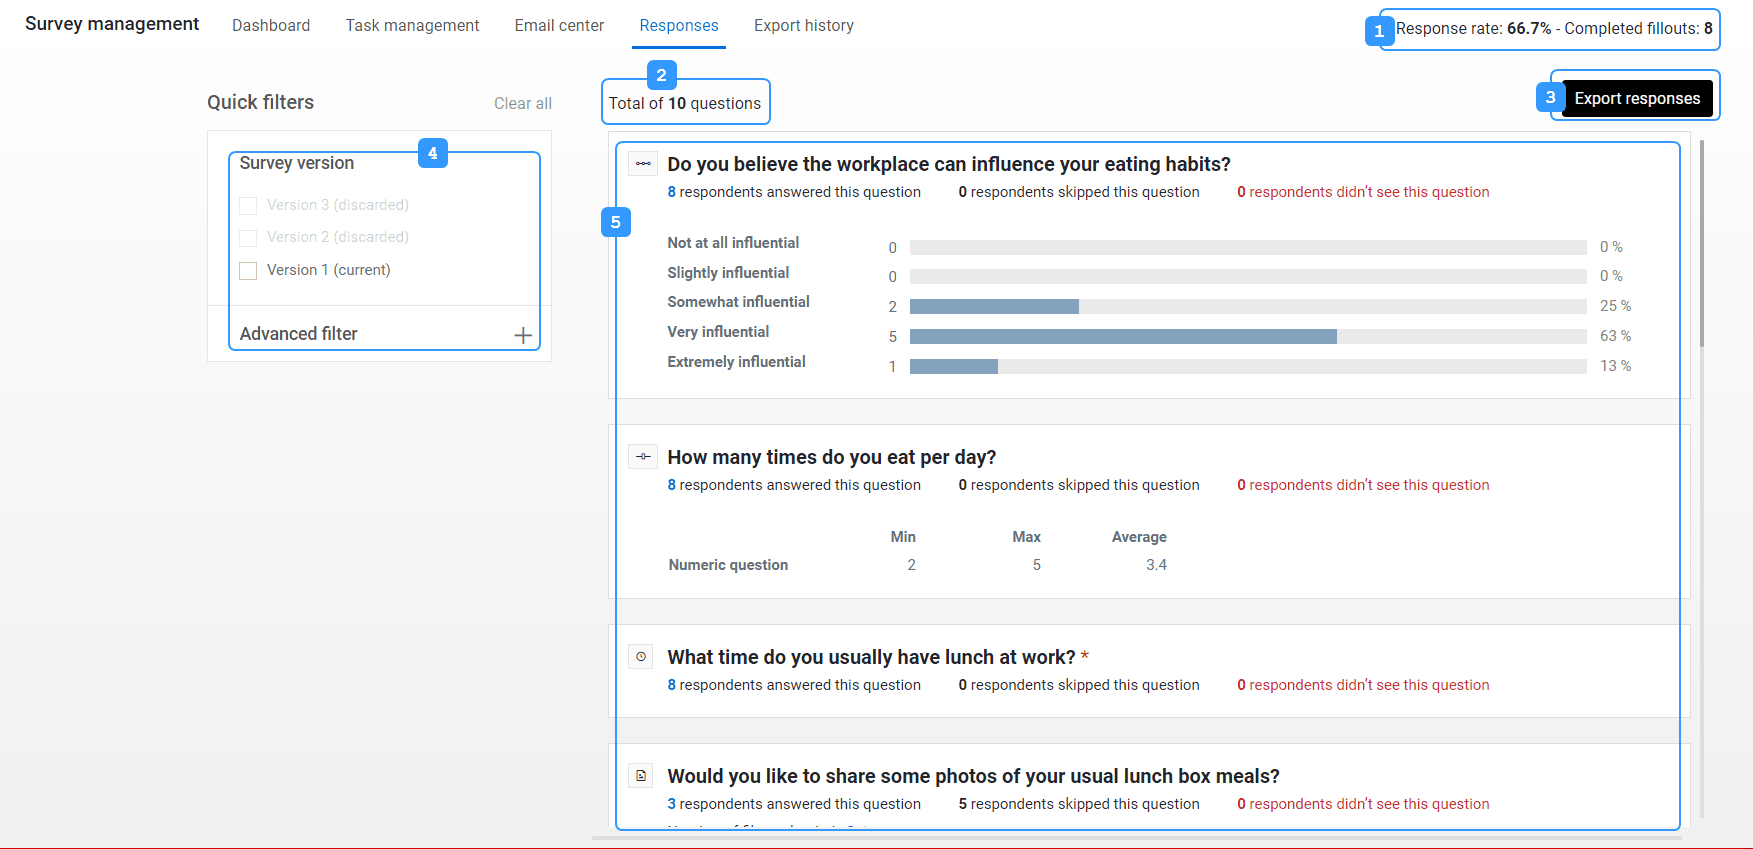
Responses analytics overview
- Response rates and how many questionnaires have been submitted.
- Total number of questions in the form.
- Export the response data to a local file.
- Filter response data based on the survey version or respondent demographics (in Advanced filter).
- Each question includes detailed statistics about the responses.
Statistics for each question type
Each question contains the following information:
- The question type (represented by its icon) and question title are displayed at the top.
- Then, the response rate is displayed.
- Followed by response analytics (varies between graphs and tables based on the question type).
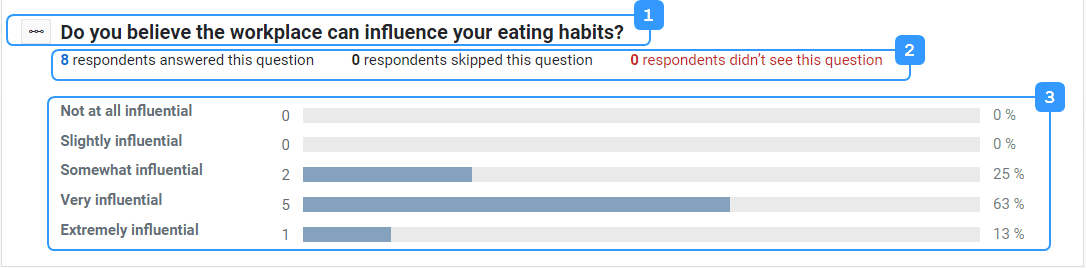
Choice question
Each selection and the number of respondents that selected that answer is displayed in a bar chart.
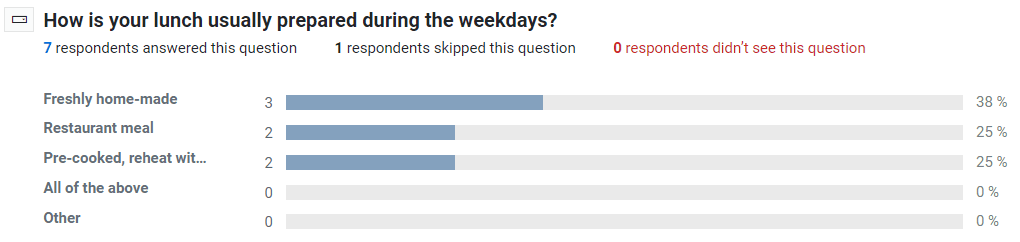
A grayed-out selection in the chart means this choice answer was deleted in a survey version.
Comment question
Only respondent related statistics are displayed for a comment question. To see what responses were submitted, you will need to export the responses.

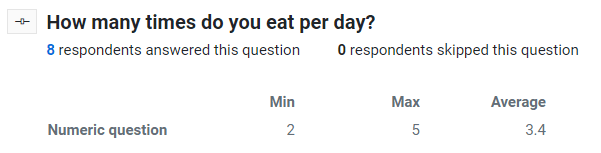
Numeric question
The numeric question displays the minimum and maximum value that respondents have answered, as well as the average.
Date / time question
Just like comment questions, date or time questions have a large array of possible responses. Only respondent related statistics are displayed. To analyze the responses, you will need to export the responses.

Scale question
Scale questions and choice questions are very similar when it comes to statistics. Each selection and the number of respondents that selected that choice are displayed in a bar chart.

A grayed-out selection in the chart means this choice answer was deleted in a survey version.
Constant sum question
In order to properly visualize the results of a constant sum question, a table is used to display the distribution of responses for each item. Similar to numeric questions, the constant sum displays the minimum and maximum value that respondents have answered, as well as the average.

Ranking question
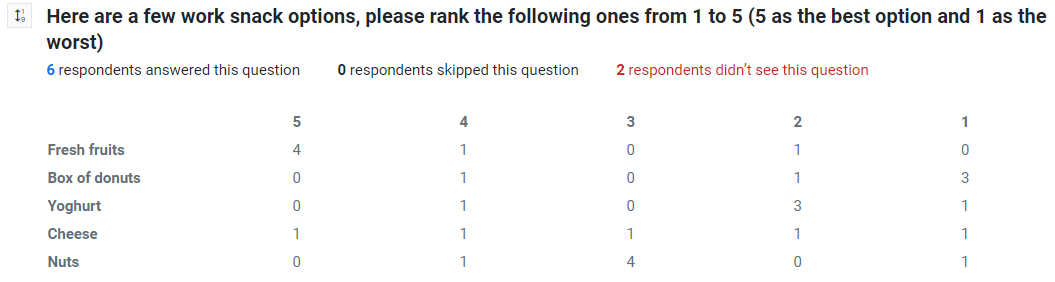
Ranking question results are displayed in a table in order to clearly indicate the ranking for each available item. The ranks are displayed at the top of the column. The number of responses for each rank is displayed below.
In the example below, four respondents ranked "Fresh fruits" as the best option ("5" as the best), one respondent ranked it second best, while another ranked it second last.
Media response question
Media response questions only display the number of uploaded files, in addition to respondent related statistics. To obtain the files uploaded by the respondents, export and download the responses.