MLY in Blue Reports guide
Exploring MLY based text analytics
MLY is a revolutionary advancement in the field of feedback analytics. Pronounced as "mi-lee", MLY represents the intersection of machine learning (ML) and the pursuit of answers (Y), where AI-powered feedback analysis becomes a powerful tool to understand and amplify the Voices of Employees and Students in Learning & Development (L&D), Human Resources (HR), and Higher Education (HE) domains.
MLY enables organizations to gather and interpret text feedback (comments) from students and employees throughout their academic and employment journeys. The analysis of these comments reveals key insights that empower leaders to address challenges in areas such as engagement, inclusion, performance, attrition, learning enhancement, organizational agility, etc.
Customers have shared valuable insights into the advantages of using MLY, including:
- Time-saving efficiency: MLY processes thousands of comments in just minutes, dramatically reducing analysis time.
- Uncovering hidden insights: It helps organizations identify valuable perspectives they may have previously overlooked.
- Driving impactful decisions: These insights empower teams to develop action plans that enhance performance across their organization.

MLY produces insights using the following analysis types:
| Analysis type | Name | Includes | Includes | Includes |
|---|---|---|---|---|
| EEI | Employee Experience Insights | Sentiments | Recommendations | Alerts |
| ELI | Employee Learning Insights | Sentiments | Recommendations | Alerts |
| SEI | Student Experience Insights | Sentiments | Recommendations | Alerts |
Each analysis type (model) focuses on a specific set of themes and topics. To learn more: Introduction to insights
Blue projects can now be customized to include specific questions for MLY analysis, with data uploads performed manually or scheduled daily. Once MLY processes the data, insights become available in Blue reports, featuring sentiment analysis, recommendation analysis, theme clouds, and frequency or cross-tabulation tables and graphs. These insights allow organizations to correlate MLY analysis results with question responses or user demographics.
Additionally, comments containing harmful text, or potential issues can be flagged for removal or redaction, helping to maintain a secure and responsible reporting framework.
Benefits of MLY Integration with Blue Data:
- Comprehensive Data Analysis: By integrating Blue’s raw comments and demographic data, MLY can perform detailed text analytics, offering richer insights into customer feedback.
- Real-Time Feedback Monitoring: With daily data uploads, MLY can continuously monitor feedback, allowing organizations to track sentiment trends and emerging issues in real-time.
- Proactive Alerts and Recommendations: MLY can identify critical alerts and provide actionable recommendations based on the integrated data, helping organizations address issues promptly and effectively.
Understanding data ownership - Who owns customer data in MLY?
Customers retain ownership of their data once uploaded and analyzed by MLY. In addition, customer data is only used in training MLY if the customer has provided written consent.
Crafting effective questions for MLY analysis
Not all course evaluation questions are suited for MLY analysis. Multiple-choice, yes / no, and other structured questions with limited answer choices can be efficiently processed using traditional quantitative analysis tools. In contrast, MLY is most effective for analyzing open-ended questions designed to gather detailed feedback on the student, employee, and learning experiences.
IDEAL QUESTIONS
MLY is best suited for analyzing comments from open-ended questions related to student experience, employee experience, and learning experience. By applying sentiment, recommendation, and alert analysis, MLY provides deeper insights into qualitative feedback, helping organizations better understand key trends and concerns.
Course Evaluation Questions
- What are the key strengths and areas for improvement in this course?
- In what ways could this course be enhanced to improve the learning experience?
- How can the instructor refine their approach to better support student learning?
- Describe the most impactful aspects of this course and how they contributed to your learning.
- What elements of this course did you find most effective or engaging?
- What aspects of the course, if improved, would enhance the overall experience?
- How did this course meet or fall short of your expectations?
- Please share the reasoning behind your overall rating of the instructor.
- What are the instructor’s strongest qualities, and where could they improve?
- What instructional methods were most helpful in supporting your understanding of the material?
- What specific strategies could the instructor implement to improve teaching effectiveness?
- How could this unit be adjusted to better support your learning goals?
- Would you recommend this course to other students? Why or why not?
- Would you recommend this instructor to other students? Please explain.
- To what extent do you agree with the following statement: This course significantly enhanced my understanding of subject/topic.
- Please provide any additional feedback or comments about this course.
General Feedback Questions
- Is there anything else you’d like to share about your experience in this course?
- How did the instructor inspire your interest and engagement in the subject?
- What is the most valuable lesson or concept you took away from this course?
- How has this course contributed to your personal or academic growth?
- Describe your most meaningful learning experience in this course.
- Which sections or activities of the course were the most effective, and why?
Introducing MLY insights and the analytics process
Leverage MLY to analyze student and employee feedback, uncovering data-driven insights that highlight issues, blind spots, emerging trends, and actionable recommendations. These insights empower organizations to make informed decisions and take timely action to enhance both the experience and learning effectiveness.
The tables below provide a concise summary of the analysis types and key topics used in processing feedback data:
| Sentiments | Recommendations | Alerts |
|---|---|---|
| Positive | Do more | Alert scores |
| Negative | Do less | |
| Neutral | Start | |
| Not explicit | Stop | |
| Mixed | Continue | |
| Change |
Note: All analyses include Sentiments, Recommendations, and Alerts insights.
| EEI - Employee Experience Insights ( Total topics - 308) | ELI - Employee Learning Insights (Total topics - 374) |
|---|---|
| High level topics | High level topics |
| Company / Organization | Administrative Elements |
| Development / Career Opportunity | Learning Outcomes |
| Employee Qualities | Persons |
| HR | Training Content / Delivery |
| IT/ Technology | Training Environment |
| Job / Work | |
| Pay / Benefits | |
| Quality of Life |
| SEI - Student Experience Insights | (Total topics - 1094) |
|---|---|
| High level topics | Expectations |
| Administrative Elements | Face to Face Learning |
| Procedures | Feedback |
| Services | Learning Environment |
| Communication | Learning Outcomes |
| Course Content | Persons |
| Assessment & Evaluation | Programs |
| Course Material & Structure | Remote Learning |
| Practical Learning | Teaching Effectiveness |
During the MLY analysis process:
- a. A sentiment is added to each comment.
b. One or more recommendations are identified.
c. Alerts are detected.
d. Themes/topics relating to the effectiveness of the experience and/or learning are defined. - Retrieve the analyzed data from MLY Dashboard and store it in Blue projects.
- Create Blue reports to leverage the MLY insights.
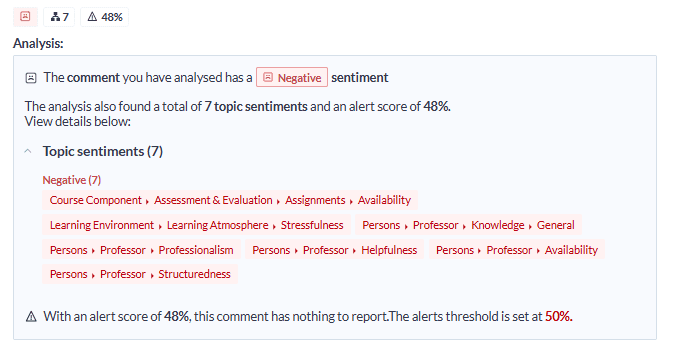
The following sample comment has been analyzed by MLY's quick analysis tool and provides an explanation of the results:
The instructor was not prepared. She was often late for class or didn't show up with little or no notice. Often, students would read the slides on the board. She didn't seem to have the knowledge of the subject matter to convey to her students information that we couldn't deduce from the readings. In addition, its disorganization meant that we had no homework to hand in before the drop-out date and that 100% of our grade is based on a single course in which 3 pieces of research, a group presentation and 7 to 15 response papers are expected. This created a very stressful environment for me and the other students in the class.
Leveraging MLY analytics in Blue - A high-level overview
Blue projects can now be configured to include specific questions for MLY analysis, with data uploads either performed manually or scheduled daily. Once processed by MLY, insights become available in Blue reports, offering sentiment and recommendation analysis, word clouds, and frequency and cross-tabulations tables and graphs that link MLY findings to question responses and user demographics.
Additionally, comments containing harmful text, or potential risks can be flagged for removal or redaction, ensuring reports remain accurate and safe for review.
Organizations leveraging the MLY AI platform have access to immense potential, but realizing its full benefits depends on the strategic and effective deployment of the technology. This article outlines key considerations for successfully integrating MLY into your organization.
Before creating a questionnaire:
Understand the Challenges of Free-Form Feedback Analysis
- While human reviewers provide greater accuracy, computers can analyze significantly larger volumes of data at much faster speeds.
- Regional dialects, slang, and informal language may influence results.
- Context matters—framing questions correctly can greatly improve the insights gathered.
Ask the Right Questions the Right Way
- Keep questions focused on a single subject (e.g., instructor, coursework, university experience).
- Opt for open-ended questions—avoid prompts that lead to one-word responses.
- Provide clear guidance to ensure respondents understand what’s being asked.
- Separate advantages and disadvantages into different questions rather than combining them into one.
Familiarize Yourself with MLY Analysis Types
MLY offers domain-specific analysis, including:
- Employee Experience Intelligence (EEI)
- Employee Learning Intelligence (ELI)
- Student Experience Intelligence (SEI)
By structuring questions effectively and understanding MLY’s capabilities, organizations can unlock richer insights and enhance their feedback analysis process.
After responses have been gathered:
- Select Relevant Data for Analysis - Choose the comment questions and demographics to upload and analyze using MLY.
- Generate and Distribute Reports - Produce reports that highlight top-ranked MLY insights for your organization, alongside the original comments for context.
- Conduct Deeper Analysis - Create reports that cross-tabulate MLY data with specific questions to uncover correlations and generate additional reports that compare MLY findings with demographic data to identify patterns and trends.
- Explore Insights Directly in the MLY Dashboard - Dive deeper into the data by leveraging the MLY dashboard for comprehensive analysis and discovery.
Setting up and managing MLY in Blue Reports - Key configuration steps
Maximum comments per analysis
- Up to 10 comment questions can be used for a single analysis.
- A maximum of 400,000 total comments can be uploaded across all questions in the analysis. (example: 2 questions with up to 200,000 comments each, or 10 questions with up to 40,000 comments each).
- Up to 49 questions and demographics combined can be processed by a single analysis. (example, up to 5 questions and 44 demographics, up to 10 questions and 39 demographics).
- If you are using a multiple secondary definition type, the primary and secondary subjects are analyzed separately meaning that the above limits apply for each analysis.
Multilingual analysis
- The Multilingual analysis supports the translation of non-English comments to English only.
- In Translation mode, MLY does not currently process redacted comments. It will only translate original comments.
- The report creator can display translated comments and redacted comments in separate blocks and separate reports for the same project.
Analyzing your MLY data
- When clicking the Start button to perform the analysis, the process will continue in the background.. If you stop the analysis midway, the process continues in the background and the entire applicable quota is applied for all the comments analyzed.
- When using manual redaction, analyzing the same question with multiple analysis types (models) may result in manual redactions not appearing in the reports. Instead, either the original comment or if redacted the last redacted version will be displayed.
- If a report gets updated before the MLY analysis has been generated, the original comments will be displayed.
- MLY in Blue Reports currently does not support Custom analysis and this type of analysis is unavailable through Blue. Please note that if an Admin reruns an existing analysis created in Blue using a Custom Analysis, the associated Blue project and reports will not be updated within Blue.
Alerts thresholds applied in comment blocks
- When thresholds are applied, the Alerts are displayed in percentage. Floor rounding is used to convert any alerts calculations including decimal points to an integer (example: 90.4555% is rounded down to 90%).
Prerequisite
To configure MLY in Blue
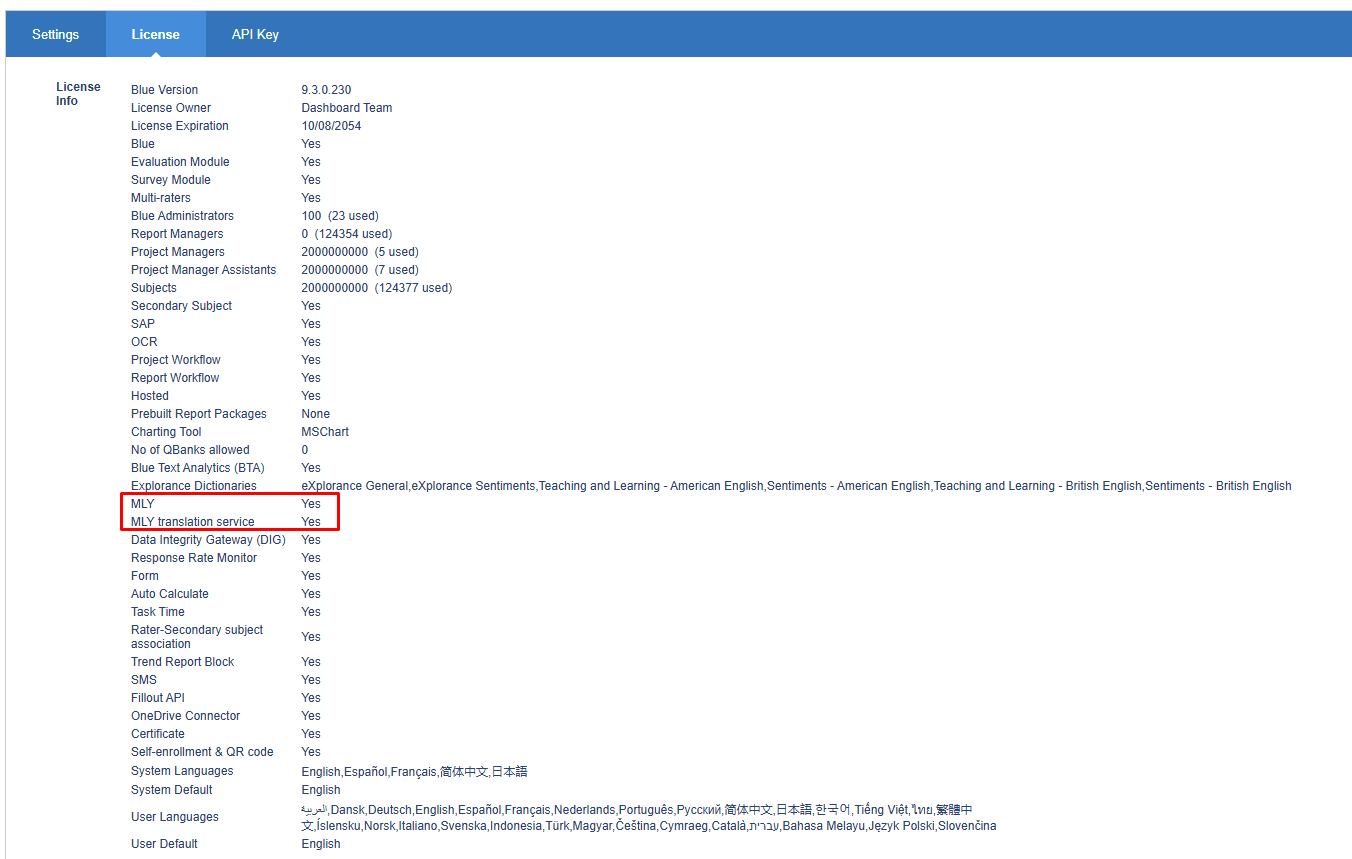
MLY in Blue Reports is a license controlled feature of Blue.
Verify that MLY is enabled in Blue: In Blue, log in as a Blue administrator and navigate to CONNECTION > LICENSE to view the license Info.
Establish a connection with MLY: The Blue support team will configure the Blue settings to correctly identify the MLY location and establish the appropriate connection properties.
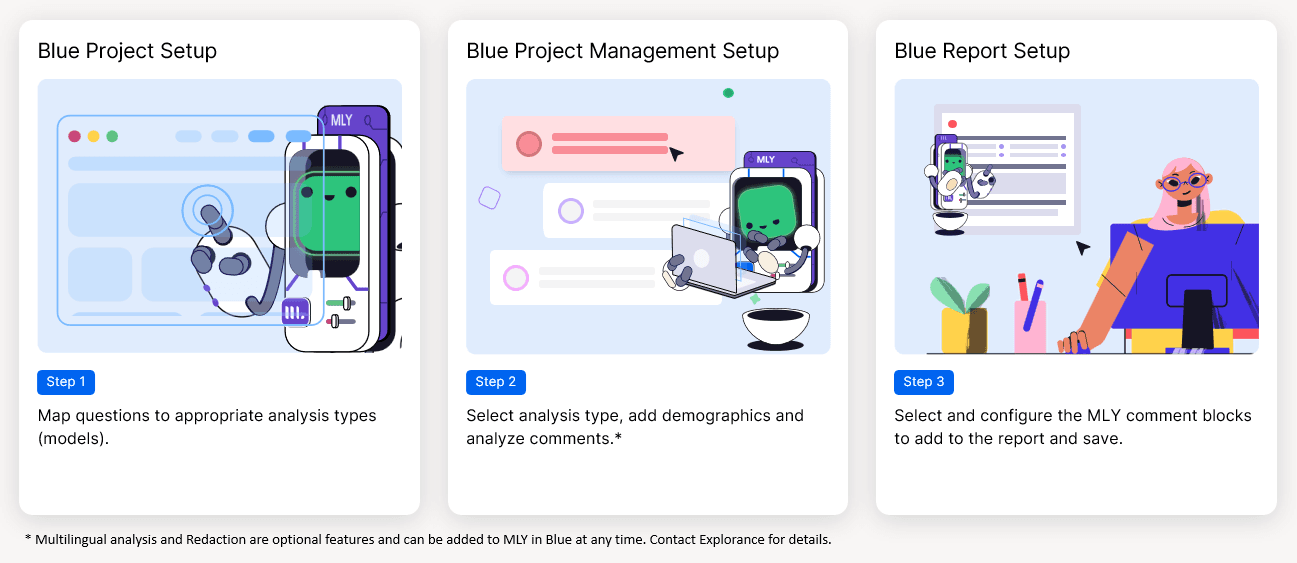
Step 1 - Link MLY comment questions to appropriate analysis types
Link MLY to a project
In your Blue Project, map your quantitative comment questions with the relevant MLY analysis type(s). These analysis types (models) will be applied to analyze the comments and generate insights for your reports. Examples of these analysis types (models) include SEI (Student Experience Intelligence), EEI (Employee Experience Intelligence), and ELI (Employee Learning Intelligence).
As a project manager, incorporating MLY text analytics is a straightforward and efficient process. To get started, let's assume that you have already created and configured a project, either published or unpublished. MLY text analytics can be applied to projects that are already published and actively receiving feedback.
Steps to set up MLY text analytics for a project:
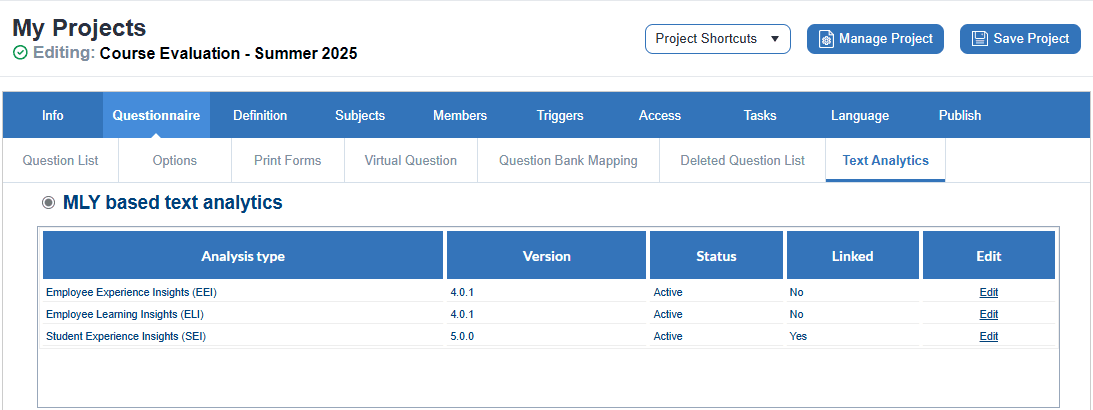
- Edit the project and navigate to QUESTIONNAIRE - TEXT ANALYTICS.
- The Text Analytics page is only available if the license has already been installed by a Blue administrator.
- Click Edit on an analysis type to associate comment type questions with it.
- All of the available MLY analysis types will be listed with a version number and status.
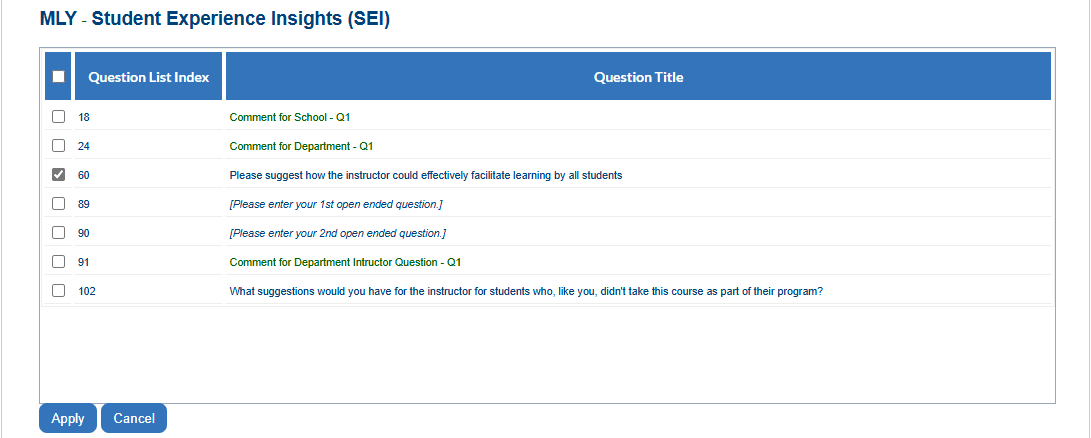
- Select the questions you would like analyzed by this analysis type (questions can be analyzed by more than one analysis type).
- Once you have selected the questions to be analyzed by the MLY analysis type, click Apply to confirm your selection.
- Finally click Save before navigating away.
Step 2 - Analyze comments responses - MLY based text analytics
MLY can be applied to both published and unpublished projects. Throughout the project's lifecycle, questions can be assigned to or removed from analysis types. As a result, feedback may not have been analyzed by the intended MLY analysis types or may have been processed using a different analysis type.
Blue is designed to accommodate such scenarios seamlessly.
The following assumes that you have a published or unpublished project with an established MLY connection for comments analysis.
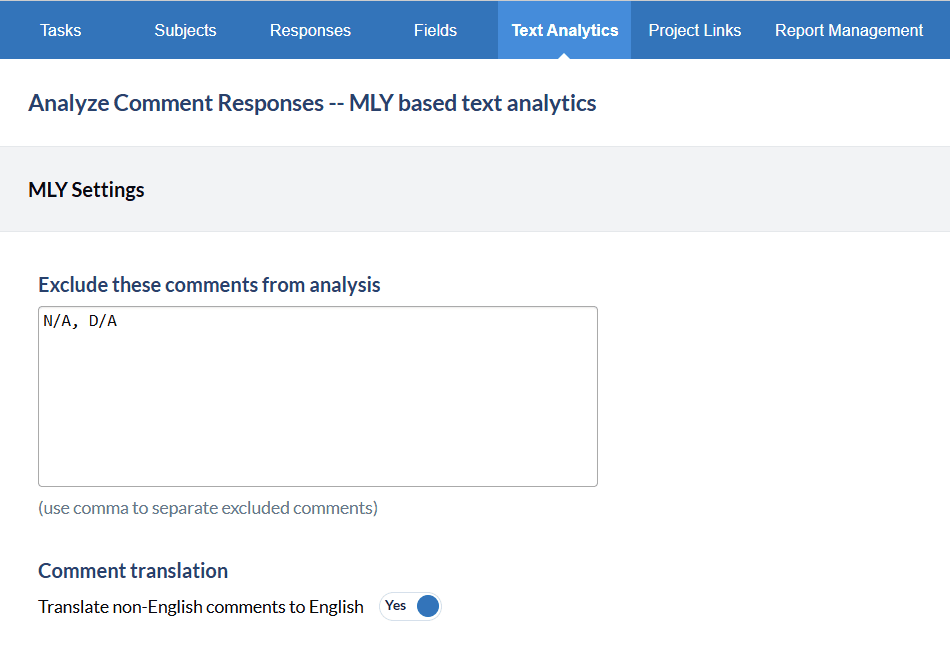
- Navigate to Blue Management > Text Analytics > MLY Settings
- Excluded comments: These comments are commonly used expressions that will be omitted from the MLY analysis when added to this section. By filtering out these words or short phrases, the system reduces the unnecessary analysis of comments that don't provide useful insights, allowing for better more accurate results. Additionally, excluded comments do not contribute to your MLY quota. By default N/A and D/A are excluded from a MLY analysis.
- Comment translation: When switched on, the non-English comments are translated into English allowing insights to be generated for them based on the English version. This provides better coverage and ensures everyone's voice is heard, as otherwise these non-English comments would not be analyzed.
If this feature is turned on in report comment blocks, then both the original comment and the translated English version will be displayed.
Consult MLY in Blue redaction for details on how to configure MLY redaction for Blue Reports.
MLY SETTINGS
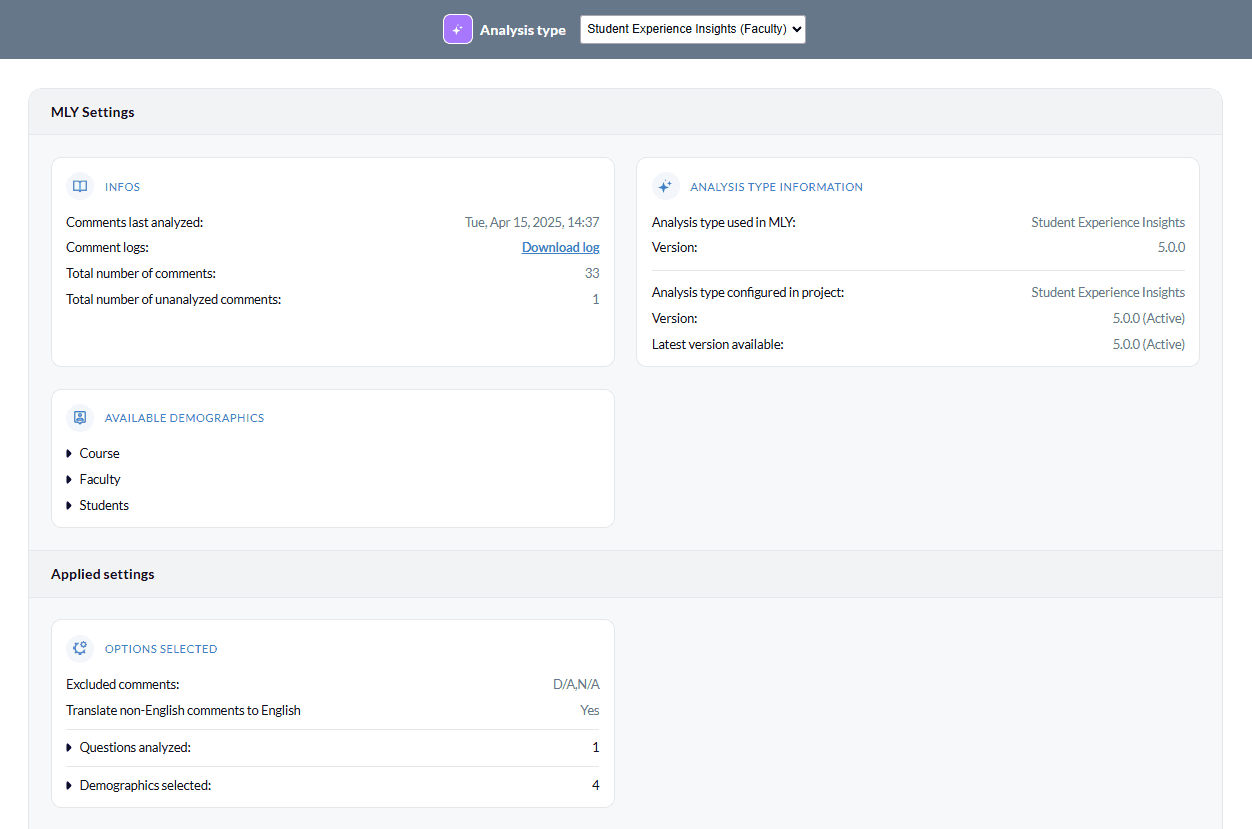
- Info: Includes a time stamp of when comments were last analyzed along with the number of comments and the number of unanalyzed comments in the project. If comments were previously uploaded, you can also download the log with details of the previous uploads.
- Model infos: Contains information on which MLY analysis versions were used to analyze your data and which version was configured in the project as well as which version is currently available in MLY. If a newer MLY analysis version is available than the one that was applied to your project, you will have the option to update your dataset without using additional quota.
- Available demographics: Selecting demographics is completely optional and is used exclusively to slice and dice the analysis directly on the MLY dashboard. Selecting demographics here has no impact on Blue reports.
- Applied settings: Applied settings is essentially a summary of the configuration and settings that will be used to determine what information is uploaded and analyzed by MLY. Review these details before proceeding to the next steps.
SYNCHRONIZATION SETTINGS
Analysis settings
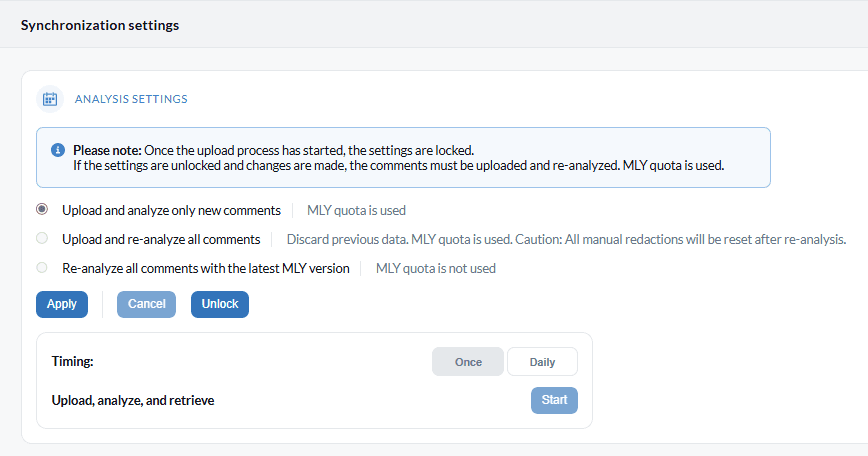
There are three scenarios that may take place when uploading data to MLY dashboard.
- Upload and analyze only new comments: This is the default scenario when uploading data to MLY. This option only analyzes new comments and these will consume the MLY quota after they have been analyzed. This scenario supports both daily scheduled upload or manual upload options.
- Upload and re-analyze all comments: Once the upload process has started, the settings are locked. If the settings are unlocked and changes are made, the comments must be uploaded and re-analyzed using this option. Please note that the previous data is discarded and since data is being re-analyzed MLY quota is used.
- Re-analyze all comments with the latest MLY version: This option is available only when a new version of a MLY analysis type is available. The system will automatically make this option available and the user can use this option to re-analyze their data with the latest version from MLY. Please note that this option does not consume additional MLY quota when analyzing the data.
- Click the Apply button to confirm the settings before uploading. After that use the Start button to trigger a manual upload or click the Confirm button after you have configured the time for the daily upload. The Cancel button or the Unlock button are available if you decide to change your mind.
- Once the data upload process begins there is a progress bar that displays on the page. The progress bar indicates which state the process is in, the data is being uploaded, or the data is being analyzed by MLY, or the analyzed data is being retrieved from MLY. The amount of time the process takes may vary greatly depending on the amount of data being processed and the MLY server workload.
Timing
There are 2 timing scenarios for updating the analysis results used in Blue Reports.
- Daily analysis: Set a time for additional Blue comments to be analyzed by MLY on a daily basis.
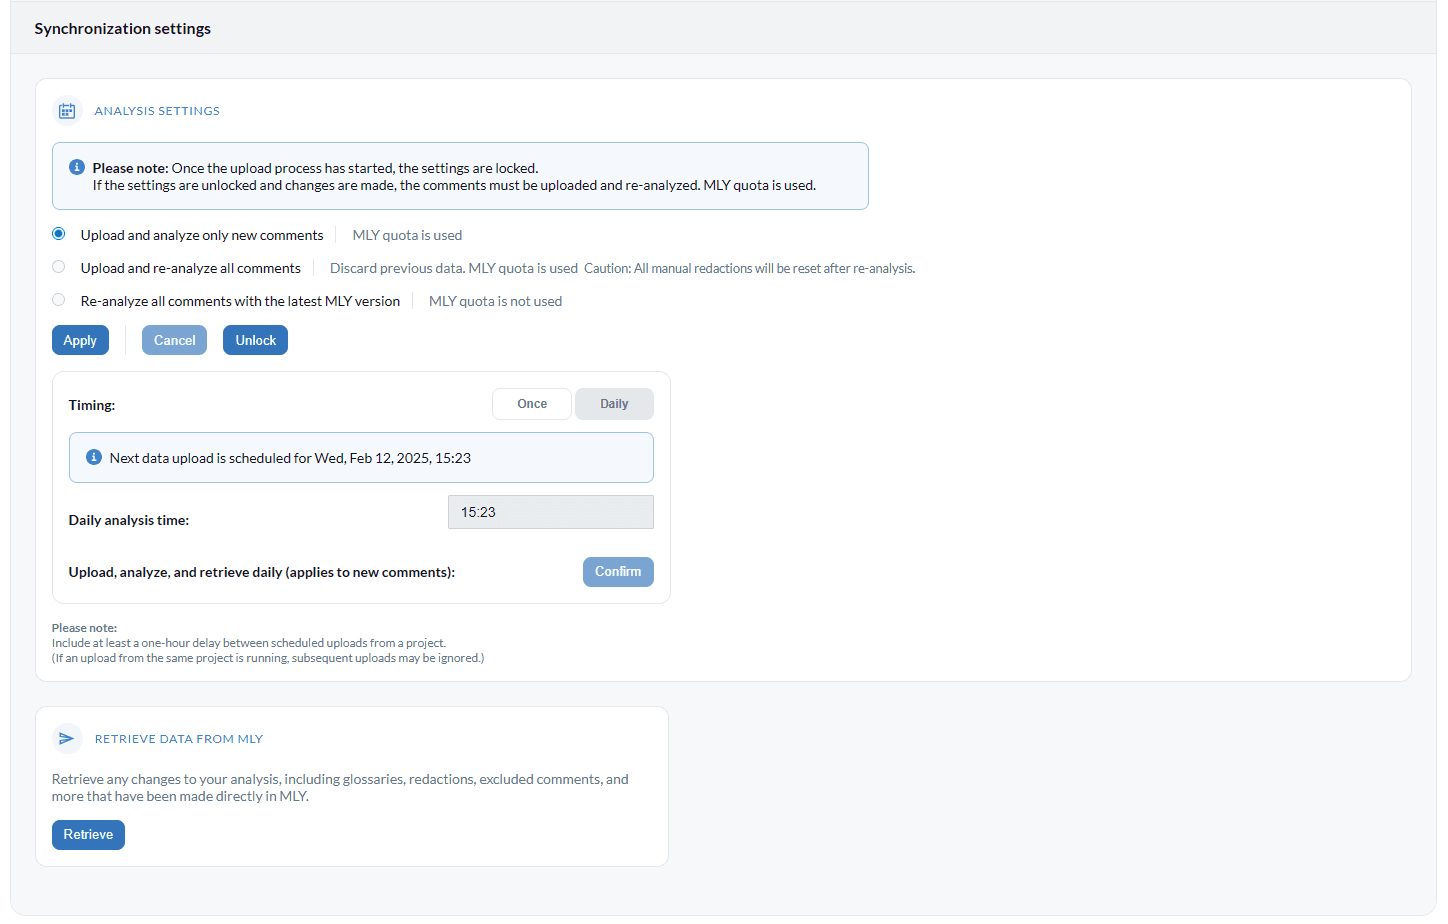
- Once (single) analysis: Set the MLY analysis of additional Blue comments to occur manually by the administrator.
During the data upload process a progress bar will appear, indicating the current stage:
- Uploading data
- Analyzing data using MLY
- Retrieving analyzed data from MLY The time taken depends on the volume of data and the number of other analyses in the queue.
Retrieve data from MLY
- Once the data has been sent to the MLY dashboard, the user has the opportunity to leverage the MLY dashboard features to further refine the analysis. After making these refinements, click on the Retrieve button to bring those changed back to Blue, such as any changes to your analysis, including glossaries, redactions, excluded comments, and more that have been made directly in MLY.

Step 3 - Add MLY report blocks to Blue reports
Blue's advanced reporting capabilities, seamlessly integrated with MLY, enhance the effectiveness of qualitative comment analysis within Blue Reports. The MLY report block utilizes powerful text analytics to extract meaningful insights from open-ended responses, strengthening data-driven decision-making.
Follow these steps to include MLY text analytics in Blue Reports:
- Open an existing report, or create a new report
- Navigate to the Content > Blocks > Report Block List and click Add Report Block.
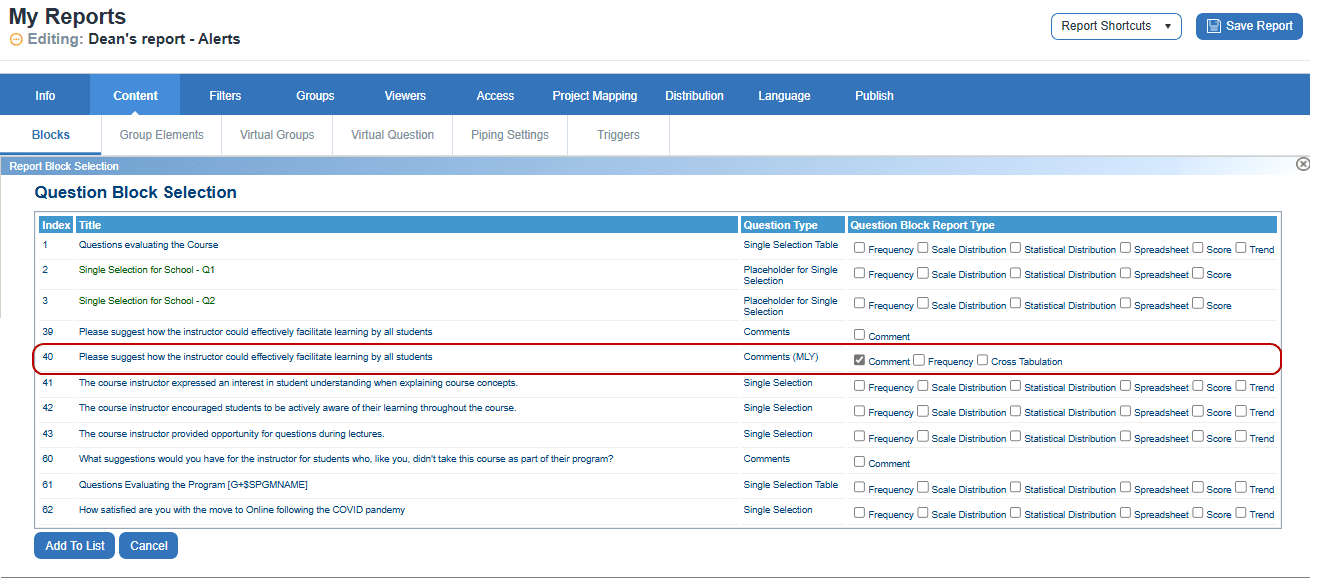
- Select the MLY Comment Question(s) in the Question Type column and click the Question Block Report Type.
- Click Add To List and the **Question Block Selection window will open.
- Select one or more of the question block report types
a. All the questions in the questionnaire appear in Question Block Selection window.
b. If a comment type question doesn't have Comment (MLY) applied, the additional question block report types will be replaced with a short message.
c. Any comment type questions with MLY Text Analytics applied will allow you to choose the additional question block report types:
- Comment - a list of the comments with redaction, translation, or MLY alert score.
- Frequency - graphical or tabular display how often particular insights are identified in the response data.
- Cross Tabulation - graphical or tabular display how often a MLY insight occurs among certain demographic groups.
- Click Add to List to create the selected MLY question report blocks and be redirected back to the Report Block List.
- Click Edit or Preview for any of the Question Type Report Blocks to adjust the default settings as necessary.
- Finally, navigate to the PUBLISH page to generate and publish the report the same way you would any Blue report.
Introduction to MLY analytics report blocks
MLY report blocks are specifically designed to transform comment feedback into clear and concise visual representations. These dynamic visualizations allow report viewers to efficiently identify data anomalies, emerging trends, and critical insights, enabling them to take informed action with confidence.
While the default settings of MLY report blocks provide compelling and effective visuals, further customization can enhance the clarity, relevance, and impact of the data being presented. By fine-tuning attributes such as scaling, categorization, and display preferences, users can tailor reports to align with their analytical goals.
Additionally, MLY report blocks share a set of streamlined attributes that improve usability and customization, ensuring that users can adapt their reports with ease. This consistent framework supports a seamless reporting experience while maximizing the depth and accessibility of comment analysis results.
Preview the MLY analytics report block at any time to see how changes to different attributes affect the output.
MLY comment report block
The MLY comment report block shares many characteristics with a standard comment report block, while also offering distinct MLY-specific features, including the variations outlined below:
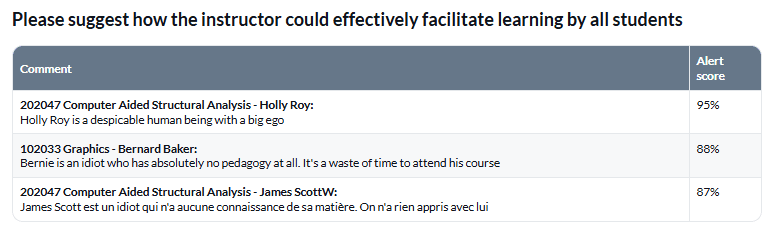
- Comments with Alerts: Displays a list of comments ranked by alert scores, which are determined by a customizable threshold. Users can choose to sort the comments in ascending or descending order based on the alert scores.
- Original comments: Showcases comments in their original form as stored in the Blue data.
- Translated comments: Presents non-English comments alongside their English translations. (Note: The Comments Translation toggle must be enabled in the Blue Project Management > Text Analytics screen for this feature.)
- Redacted Comments: Provides a list of comments with redactions applied based on the selected Redaction rule set for the MLY comment report block.
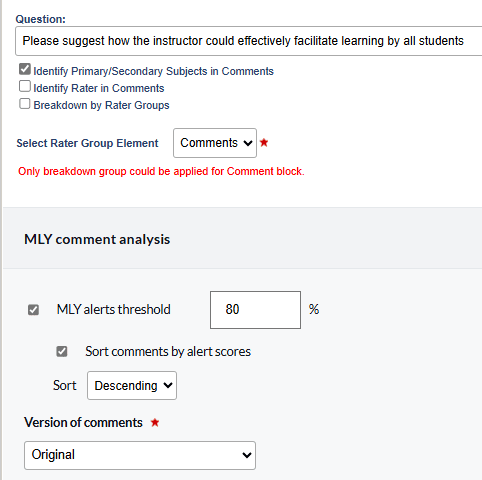
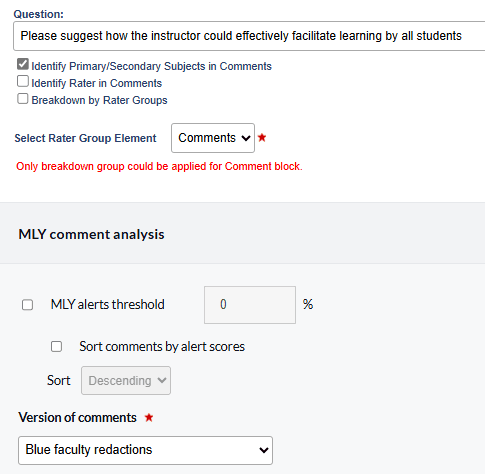
To configure a MLY comments report block with Alerts.
- Select the qualitative feedback Question it will correspond to.
- Identify a Subject, Rater or Rater group.
- Select a Rater group element if using a rater group.
- Click MLY alerts threshold and enter a percentage to display alert scores.
- Sort the alert scores either by Descending or Ascending order.
- Select the Original comments (no redaction)
- Preview the block.
- Click Apply to save.
To configure a MLY comments report block displaying Original comments.
- Select the qualitative feedback Question it will be associated with.
- Select a Subject, Rater, or Rater group.
- Select the Original version of the comments.
- Preview the block.
- Click Apply to save.
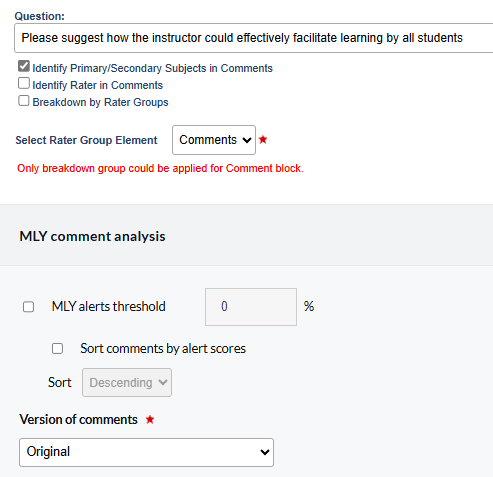
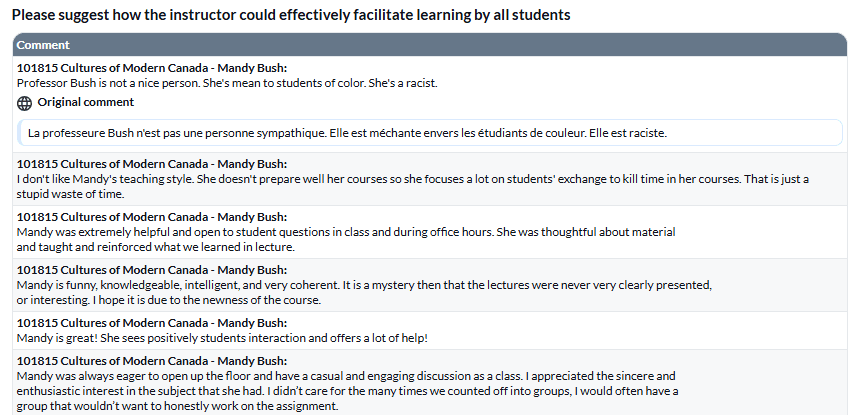
Sample of an Original MLY comments report block This block presents the raw text of comments exactly as submitted by respondents, without modifications or summarization, allowing users to review unfiltered feedback, and preserving the authenticity and nuance of individual responses. This comment format helps users, such as analysts, researchers, and leaders, interpret sentiment and intent without algorithmic adjustments.
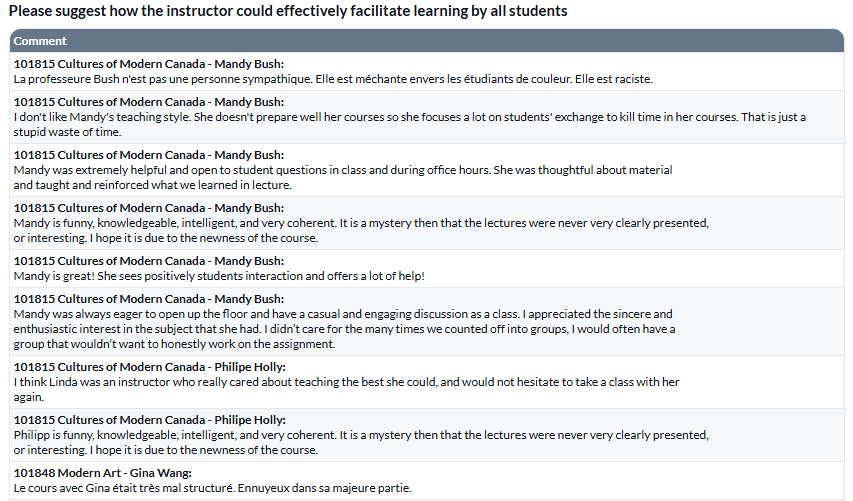
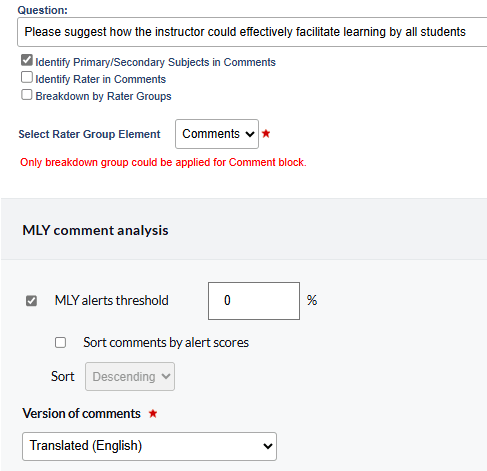
To configure a MLY comments report block displaying Translated comments:
- Select the qualitative feedback Question it will be associated with.
- Select a Subject, Rater, or Rater group.
- Select Translated English as the Version of comments for the block.
- Preview your block.
- Click Apply to save.
Sample of a MLY Translated comments report block This block presents respondent feedback in both its original language and English translation, allowing for seamless multilingual analysis without losing context or meaning. By ensuring accessibility across languages, it provides instructors, managers, and decision-makers with a more comprehensive view of feedback, helping them identify key insights across the entire organization or institution.
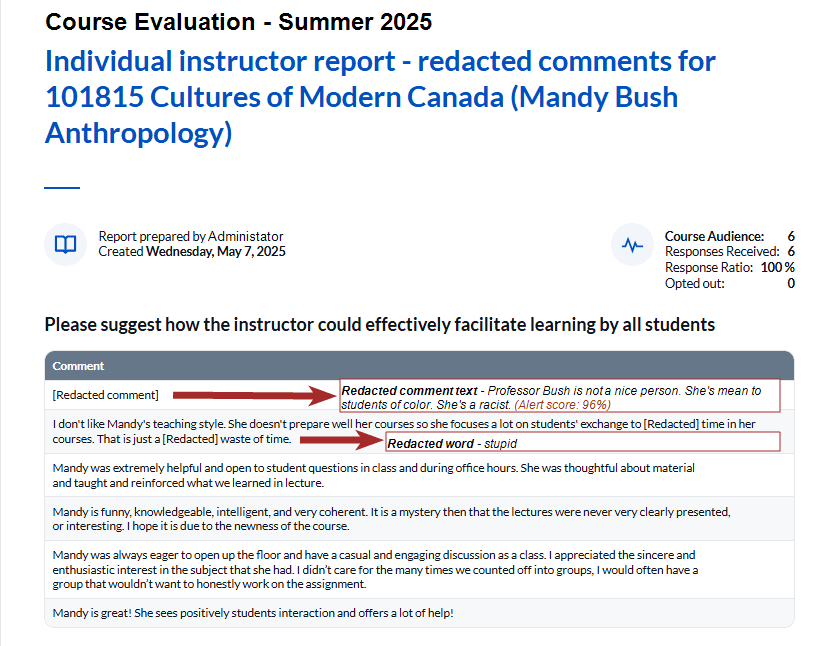
To configure a MLY comments report block displaying Redacted comments:
- Select the qualitative feedback Question it will be associated with.
- Select a Subject, Rater, or Rater group.
- Select Redaction rule set as the Version of comments for the block.
- Preview your block.
- Click Apply to save.
Sample MLY redacted comments report block This block presents respondent feedback with sensitive or inappropriate content automatically removed based on predefined redaction rules. This ensures that comments remain constructive while safeguarding psychological safety and inclusivity.
- MLY comment blocks do not support project mapping in this release.
- Translated comments are supported in the MLY comment block as well as in the Response sheet block.
MLY frequency report blocks
The MLY Frequency Report Block is a powerful tool designed to analyze and categorize qualitative feedback, making it easier to identify key themes and trends within large volumes of responses. By leveraging MLY’s advanced analytics, users can efficiently sort and quantify comment data, translating unstructured feedback into actionable insights.
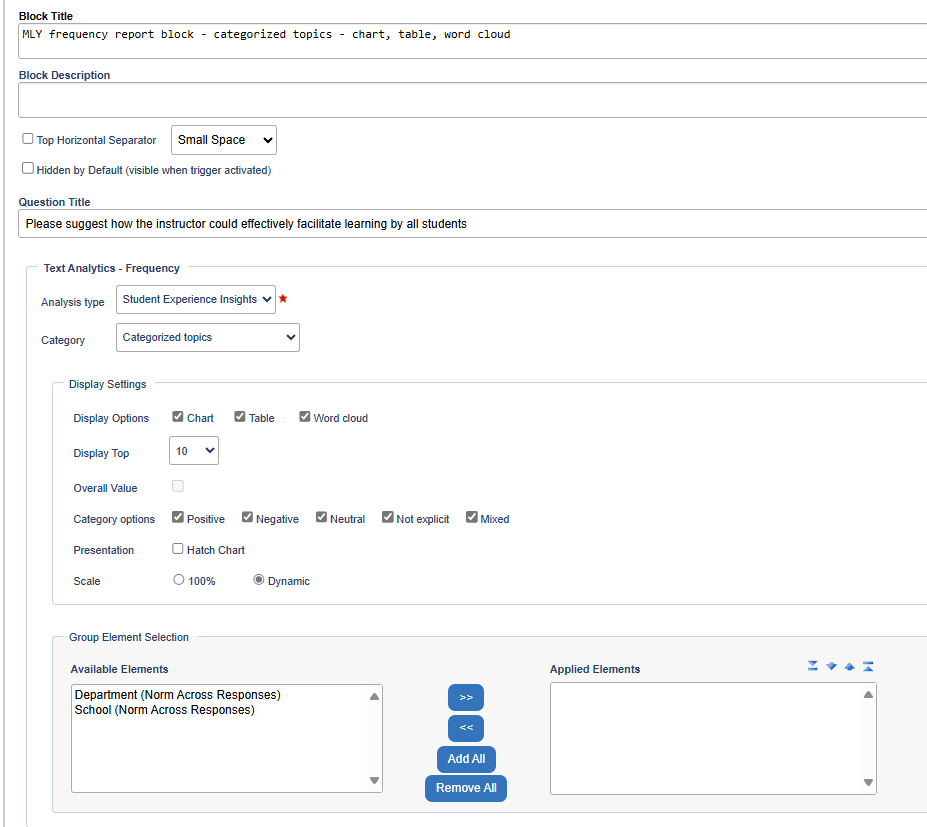
To configure a MLY frequency report block (categorized topics. categorized and uncategorized recommendations and general sentiment)
- Select the qualitative feedback question that the block will be associated with.
- Depending on the nature of the analysis, multiple Analysis types (models) may be available for the selected question—each offering distinct categorization methods that impact the insights generated. Select one of the analysis types (models) if more than one is available.
- MLY frequency report blocks allow users to choose from the following options:
- Categorized Topics – Organizes comments based on sentiment (e.g., positive, negative, neutral).
- Categorized Recommendations – Groups feedback into actionable suggestions (e.g., start, stop, continue).
- Uncategorized Recommendations – Captures general recommendations without predefined classifications.
- General Sentiments – Highlights emotional tones within responses.
- Choose from 3 Display options: Chart, Table or Word cloud.
- Once the report is generated, MLY automatically sorts comments into specific insights, displaying the most frequently occurring topics or recommendations. Users can refine their reports by adjusting the Display Top setting, which controls the number of top-ranked insights included in the final output.
- The results of the comment analysis are typically displayed as a percentage of the number of responses received. Enabling Display Overall Value adds the actual number of responses for each insight, percentages are still displayed on the report as normal.
- The available category options will change based on which category the block is configured to include. For example the options for categorized topics are positive, negative, neutral, not explicit, and mixed. The options for categorized recommendations are: do more, do less, start, stop, continue, and change. It is also possible to further select only some options such as show positive only or negative only for a block.
- Customization options within the Presentation settings further enhance accessibility and readability. Users can enable hatching in charts for improved visibility and adjust the scale range to refine graphical representations..
- Finally, the Group Element Selection feature offers comparative analysis capabilities, allowing users to assess feedback differences across departments, course sections, or other project elements. This functionality provides deeper context, enabling organizations to tailor their strategies based on real-time insights.
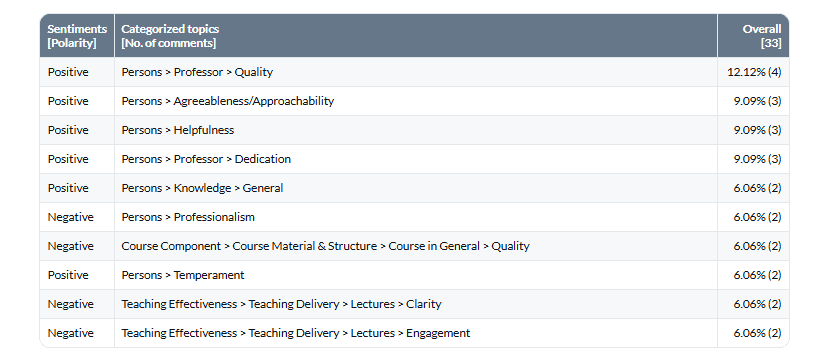
Tables
Sample MLY frequency report block displaying categorized topics in a table format By displaying sentiment analysis in a table format, users gain a clear and concise view of feedback distribution across different topics. This enhances decision-making, providing actionable insights to improve services, products, or user experiences. The tabular structure enables easy comparison and filtering, making data interpretation more intuitive and effective.
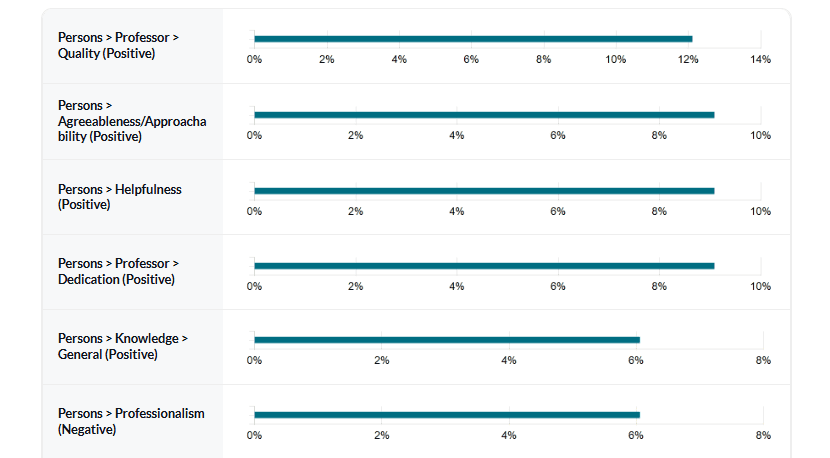
Chart
Sample MLY frequency report block displaying categorized topics in a chart format Using a chart-based approach, users can identify trends at a glance, compare sentiment proportions across topics, and highlight areas requiring attention. This method improves decision-making and storytelling, offering a clear and intuitive way to interpret large volumes of feedback effectively.
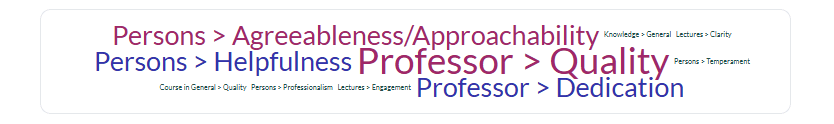
Word cloud
The Frequency report block is unique because it can create a "word cloud" style graphic of topics or recommendations that displays the relative frequency of topics or recommendations in the comments data. The more frequently a word appears in the comments, the larger and more centered the topic or recommendation is represented in the word cloud.
Sample frequency report block word cloud displaying categorized comments In this block, key topics or themes identified through MLY’s analytics are displayed, where the size and positioning of words indicate their frequency in responses. The more often a topic appears in the comments, the larger and more prominent it is in the word cloud. This simplifies complex feedback by translating large volumes of text in easily digestible graphics which allow users to quickly spot recurring concerns, positive trend, or areas needing.
MLY cross-tabulation report blocks
The Blue MLY cross-tabulation report block allows users to examine MLY analysis data in conjunction with additional variables for deeper insights. To construct a meaningful cross-tabulation report, users must first determine the type of data to integrate with the MLY analysis data, choosing either a demographic field or a question statistic.
- Cross-Tabulating with a Demographic Field: When selecting a demographic field, users must first identify the appropriate rater group. After this selection, they can specify the field that contains the relevant demographic data for analysis.
- Cross-Tabulating with a Question Statistic: Users also have the option to cross-tabulate MLY analysis data with a specific question statistic. In this approach, users need to define the scale for comparison, ensuring accurate analytical representation.
To enhance data visualization, users can select from a variety of table and chart types, which provide graphical representations of cross-tabulation results. These visual elements help convey relationships and trends effectively.
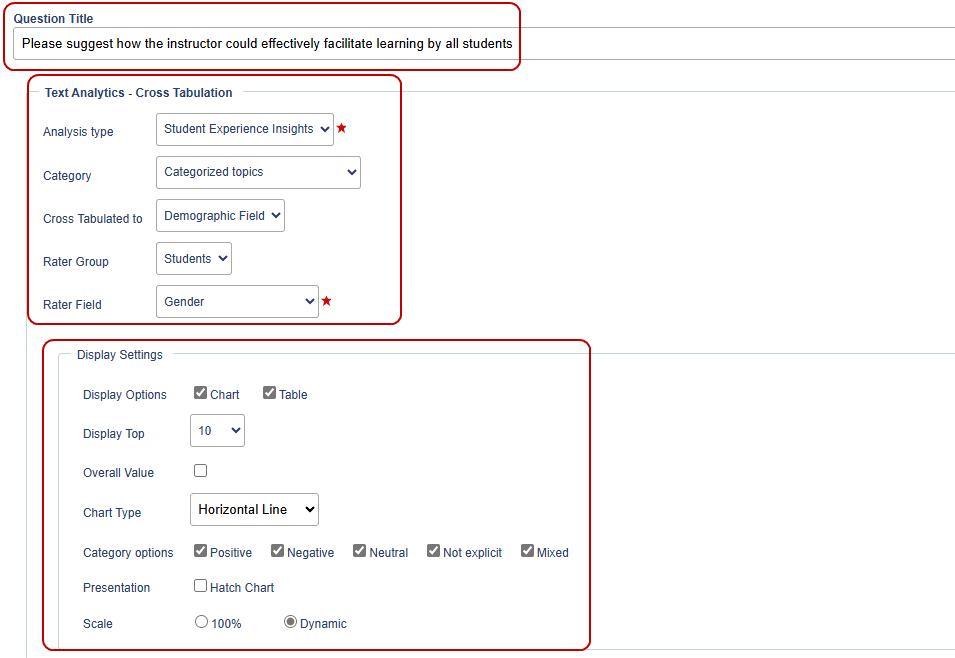
To configure MLY cross-tabulation blocks
Question Title
- Select the qualitative feedback question that the block will be associated with.
Text Analytics - Cross-Tabulation
- Analysis type (model): If more than one type is displayed in the drop-down menu, select the analysis type that will produce the insights you want to show in your report block. For example: SEI will provide results based on the analysis of Student Experience and Learning insights, ELI will provide results based on the analysis of Employee Learning insights and EEI will provide results based on the analysis of Employee Experience.
- Category: Choose what aspect of the analysis you will base your cross-tabulation from the drop-down menu containing the following items: Categorized topics, Categorized recommendations, Uncategorized recommendations, General Sentiments.
- Cross-tabulate to: Choose to cross-tabulate to either a Demographic field or Question statics.
- Rater group: Select a group from the drop-down menu such as Student.
- Rater field: Select which demographic fields from the drop-down menu that you will use in your report block
Display settings
- Display options: Select a Chart or Table or both.
- Display top: Select the range of top results you want to display in your cross-tabulation from the drop-down menu. (1 to 1094 possible selections) Once the report is generated, MLY automatically sorts comments into specific insights, displaying the most frequently occurring topics or recommendations. Users can refine their reports by adjusting the Display Top setting, which controls the number of top-ranked insights included in the final output.
- Overall value: Click this check box if you want to enable this selection. The results of the comment analysis are typically displayed as a percentage of the number of responses received. Enabling Overall Value adds the actual number of responses for each insight, percentages are still displayed on the report as normal.
- Chart types: Select from the following visualizations listed in the drop-down menu - Horizonal line, Horizontal bar, Horizontal bar_2, Radar chart.
- Category options: Select which recommendation categories you want to include in your report block. The available category options will change based on which category the block is configured to include. For example the options for categorized topics are positive, negative, neutral, not explicit, and mixed. The options for categorized recommendations are: do more, do less, start, stop, continue, and change. It is also possible to further select only some options such as show positive only or negative only for a block.
- Presentation: Click the check box for Hatch Chart to further enhance accessibility and readability. Users can enable this feature for improved visibility and adjust the scale range to refine graphical representations.
- Scale: Select either 100% or Dynamic to indicate how the scale will appear.
- Preview your report block.
- Apply for save your configuration.
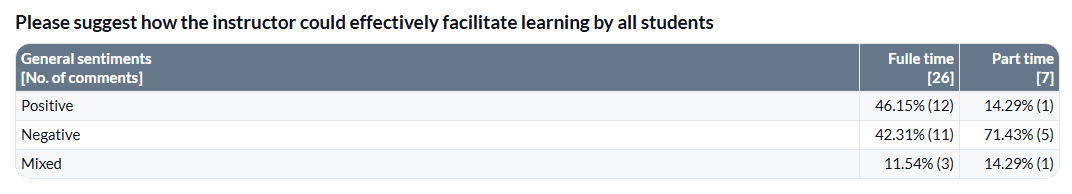
Table
Sample: MLY analysis cross tabulation table - general sentiment vs enrollment This table helps organizations understand how enrollment status influences feedback sentiment, whether students or employees feel more positive, negative, or neutral based on their engagement levels. Institutions can detect sentiment shifts over time and then proactively adjust policies and/or communication strategies and/or make improvements in program structure based on sentiment patterns linked to enrollment.
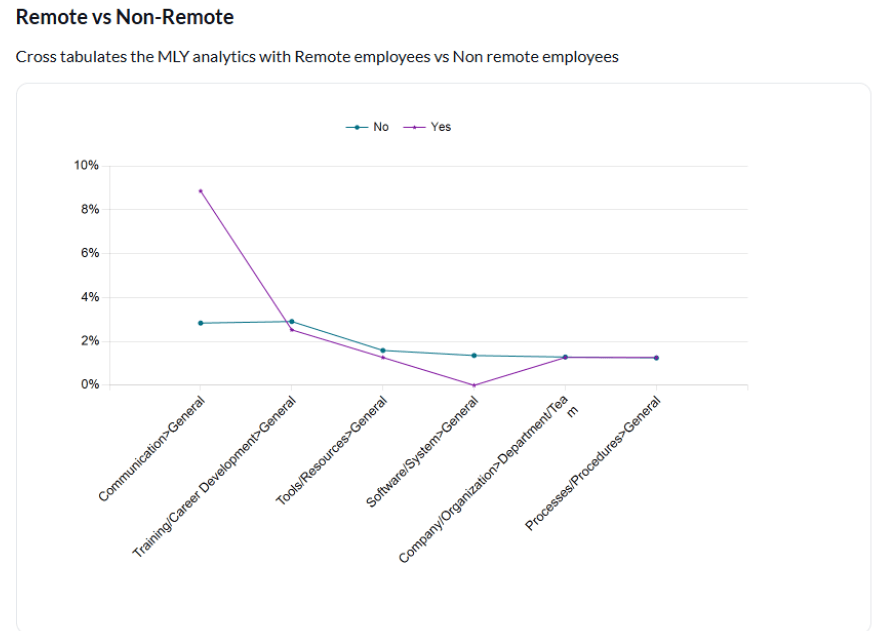
Chart
Sample - MLY analysis cross tabulation horizontal line chart - categorized topics vs remote or non-remote students or employees This visualization compares categorized topics across remote and non-remote students or employees and helps organizations understand how different work or study environments influence feedback trends. Organizations and institutions can then refine policies or engagement strategies based on topic distribution.
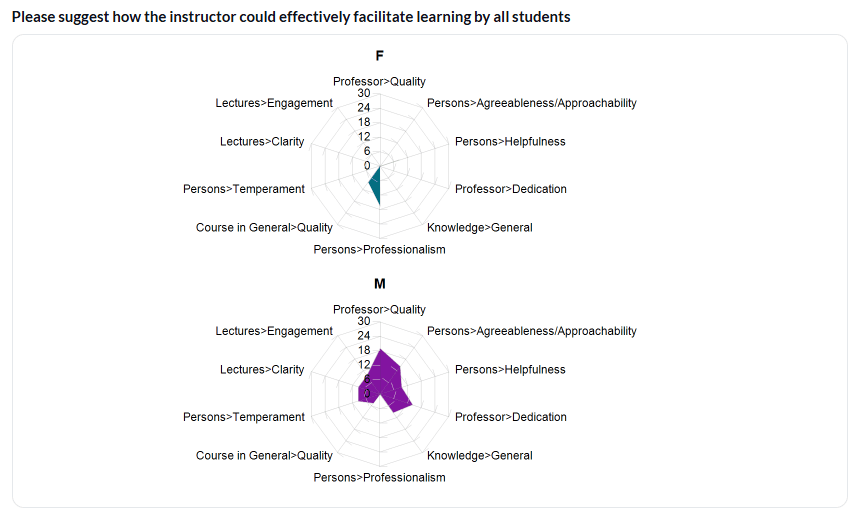
Radar chart
Sample - MLY analysis cross tabulation radar chart - categorized topics vs gender This chart provides an intuitive way to compare multiple categories simultaneously helping organizations identify patterns in feedback and understand how sentiment or key themes vary based on gender. Organizations and institutions can then refine policies or engagement strategies based on topic distribution.
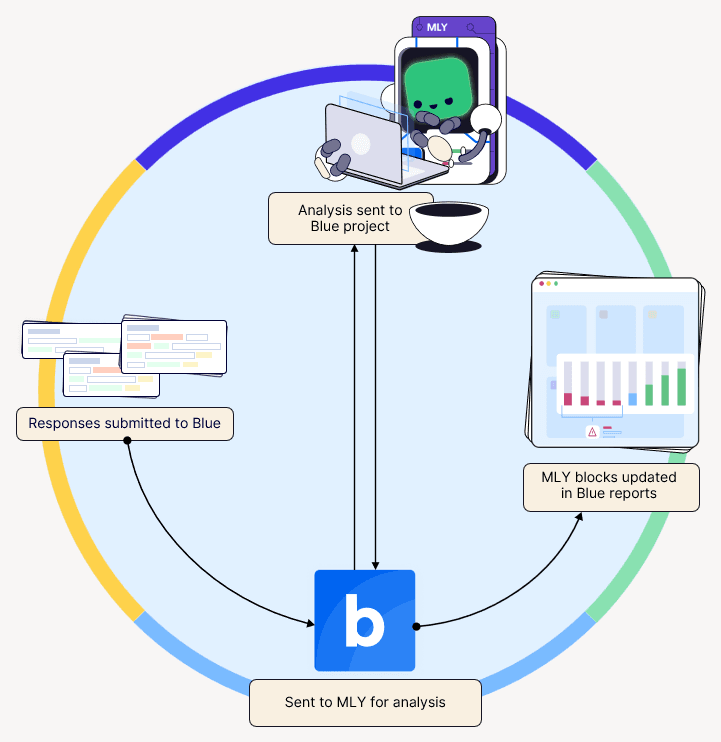
MLY in Blue data exchange
Feedback from students and employees flows into Blue as they submit their responses. Blue then sends their qualitative feedback comments to MLY for analysis. Once the analysis is complete, the results are returned to Blue, which updates the corresponding MLY blocks within the project’s Blue reports.