Implement Blue Text Analytics (Overview)
There is much potential available for institutions utilizing Text Analytics, but turning that potential into tangible benefits depends largely on the technology being properly deployed. This article suggests what you need to know to successfully deploy BTA in your institution.
Before creating a questionnaire:
- Understand the challenges of analyzing freeform feedback and how that may impact your results.
- People analyzing text will always be more accurate, but computers can analyze far more data far faster.
- Regional quirks and trendy slang may skew results.
- Context matters, so asking the right questions in the right way can dramatically improve results.
- Ask the right questions in the right way.
- Focus questions on a single subject (teacher, course work, university, etc).
- Keep questions open ended. Don't ask questions that can be answered with a single word answer.
- Provide clear guidance on what is being asked. Don't ask for advantages and disadvantages in the same question, ask for advantages in one question then ask for disadvantages in a different question.
- Get to know the dictionaries.
- Remember that the dictionary is domain specific. It is focused on higher education and assessing the student's experience with regards to the university, instructor, course, and peers.
After responses have been gathered:
- Analyze comments for the entire institution and individual departments using Blue.
- Calculate the coverage and accuracy to determine if Text Analytics is right for this project.
- Identify the top themes for the university and for each department and disseminate as appropriate. Include a brief description of each theme with the report so end users have an understanding of what those themes represent.
- Produce and distribute individual reports for each instructor. Include top ranked themes (with explanation) for the university and department as well as the full text of their actual comments.
- Dig further by generating reports that cross tabulate Text Analytics data with Single Selection questions to see how the two data points correlate.
- For deeper insights, generate reports that cross tabulate Text Analytics data with demographic data.
The following are examples taken from existing Blue Text Analytics reports that provide a small sampling of the type of reporting available for Text Analytics
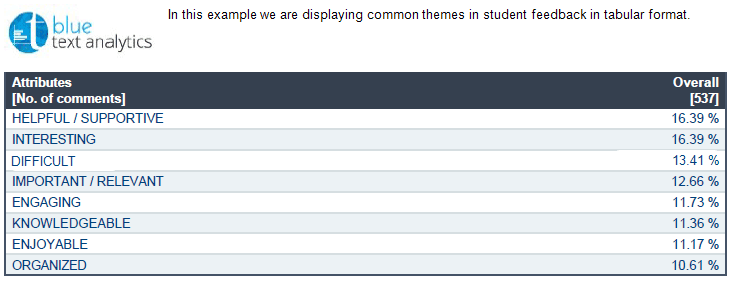
- Create a report block with the most commonly mentioned themes for the entire university. These themes and rates of occurrence can serve as a baseline to compare with other departments and individual courses.
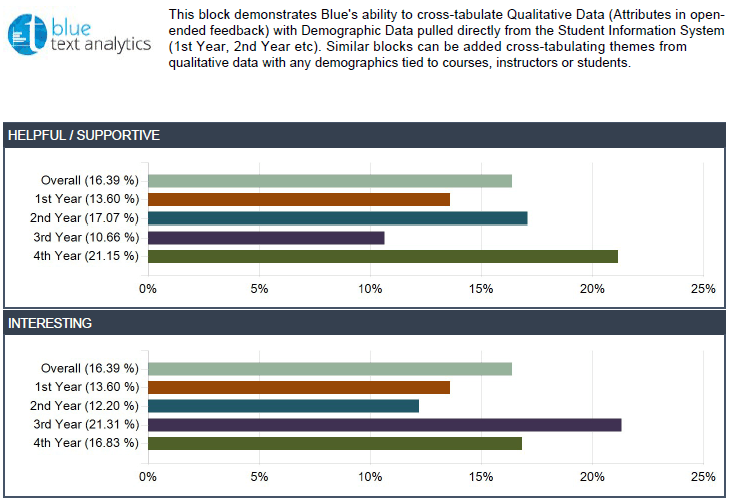
- Drill down a bit further by cross tabulating the open-ended feedback with demographic data (year of study). Gain a greater understanding of the feedback by examining qualitative data with quantitative data that is synced directly from the student information system (SIS).
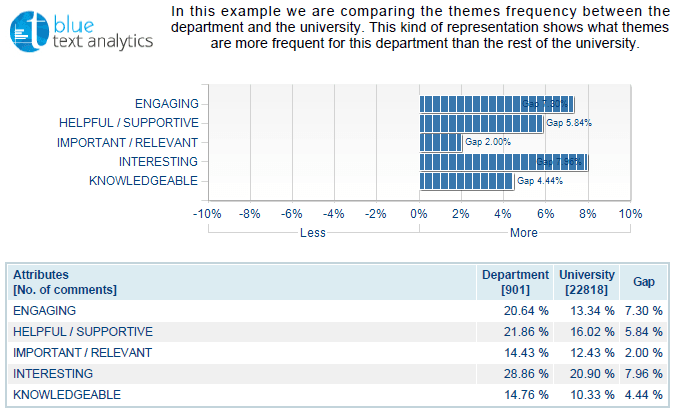
- Create a gap analysis report block to compare the most mentioned themes between the university and the department. Spot trends and outliers easily then review the full text of the feedback to identify the root cause of any significant deviations.
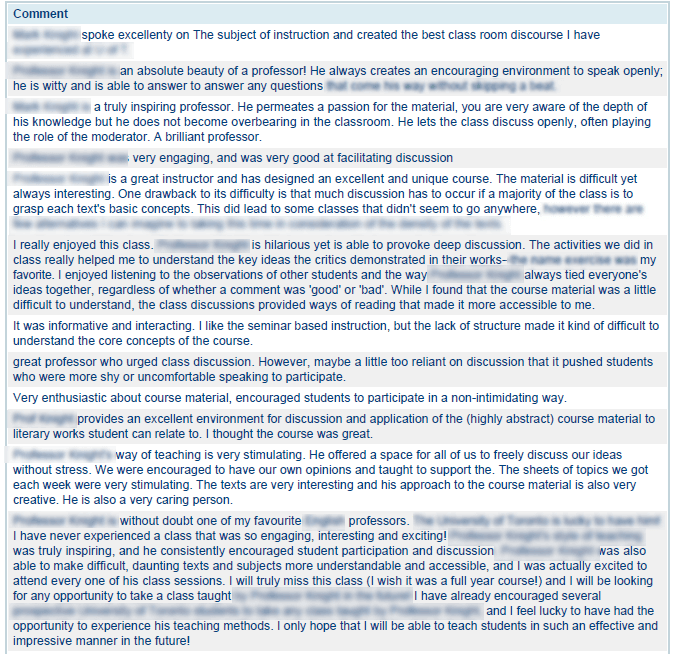
- Including the actual comments for an instructor allows them to view actual feedback by their students and to assess how they are contributing to the themes common of the larger department and the entire university.
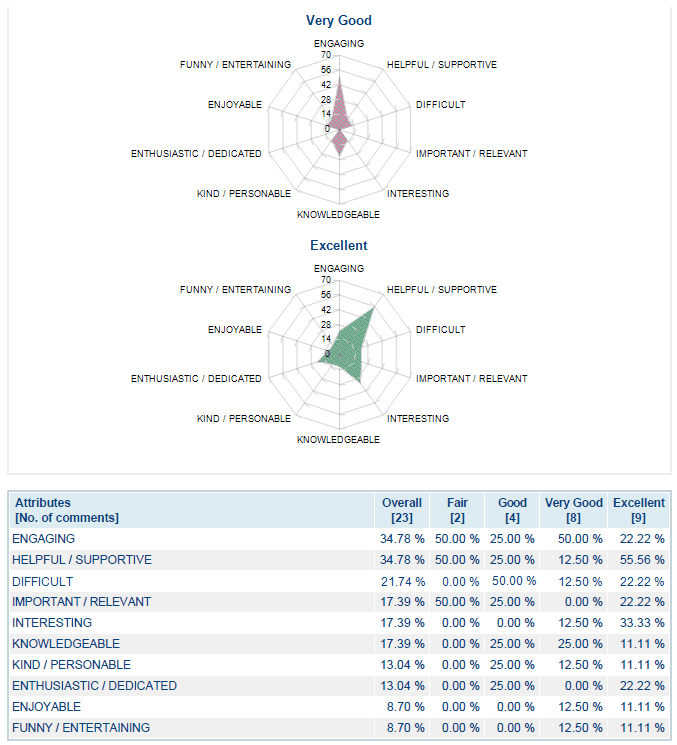
- Cross tabulate themes in Text Analytics to selections in a Single Selection question to identify correlations between the data. In this example, it appears as though students that rated the course as excellent also mentioned helpful and supportive with a high frequency.
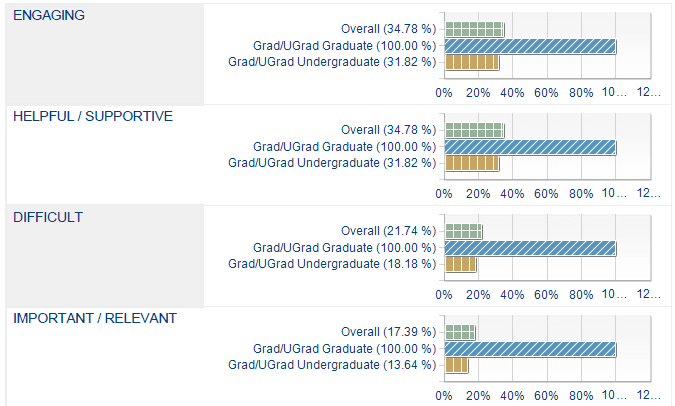
- Deeper analysis of the data can be performed by cross tabulating Text Analytics data with demographic information to reveal hidden insights. In this example, undergraduates don't feel the course is very important, but graduate students overwhelmingly do.
Related Articles
InBlue text analytics (BTA) guide
InBlue text analytics (BTA) guide
InBlue text analytics (BTA) guide
InBlue text analytics (BTA) guide