Average of rater groups
The Average of Rater Groups element enables the user to average out the results originating from different groups. In other words, if there are several rater groups in the evaluation, they can be categorized together.
This type of element can be used in a single rater group project - it will give the average for all responses in the group of raters specific to the subject of the report, students for example (whether that is a person or a course-teacher combination in an individual report, or even all raters for all subjects in a specific department or group in a Group-by report). This group element is particularly useful in 360 Evaluations where subjects will be rated by several groups, some of which have their own Blue privileges, and are located differently within the company hierarchy.
Group element configuration
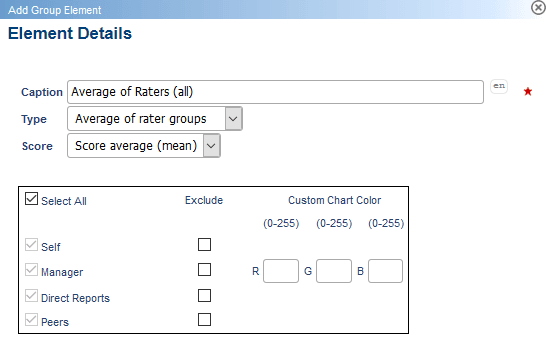
The above image is taken from a 360 Evaluation. All rater groups may be selected or a combination of them to use in the breakdown.
The Score enables the project manager to select one of the three ways to calculate the results.
By selecting the Average of Rater Groups group element type, any combination of groups can be selected allowing one of the following to be calculated:
- Score average (mean) - calculates the average score for each group and then calculates the overall average by taking the average of the average scores of each group.
- Sum total - calculates the total scores for each group and then calculates the overall sum by adding the totals for each group.
- Sum average - calculates the average score for each group and then totals the average scores.
To generate an average score for which each respondent’s score is of equal weight regardless of which rating group they belong to, create a virtual group encompassing the desired rater groups (see Virtual Groups). This applies to a specific subject.
Report block configuration and usage
Question - Score Block
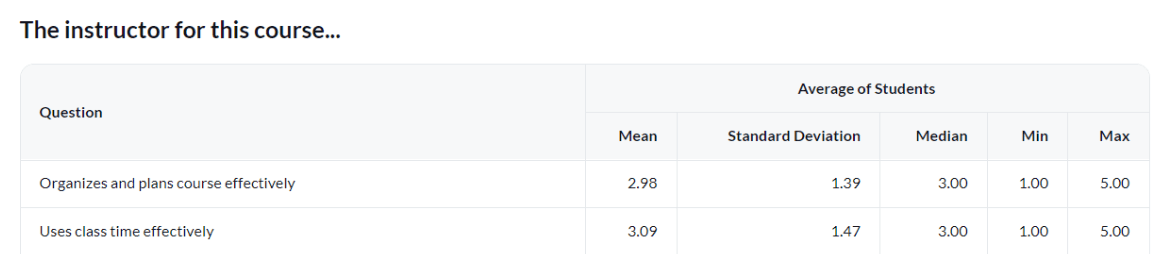
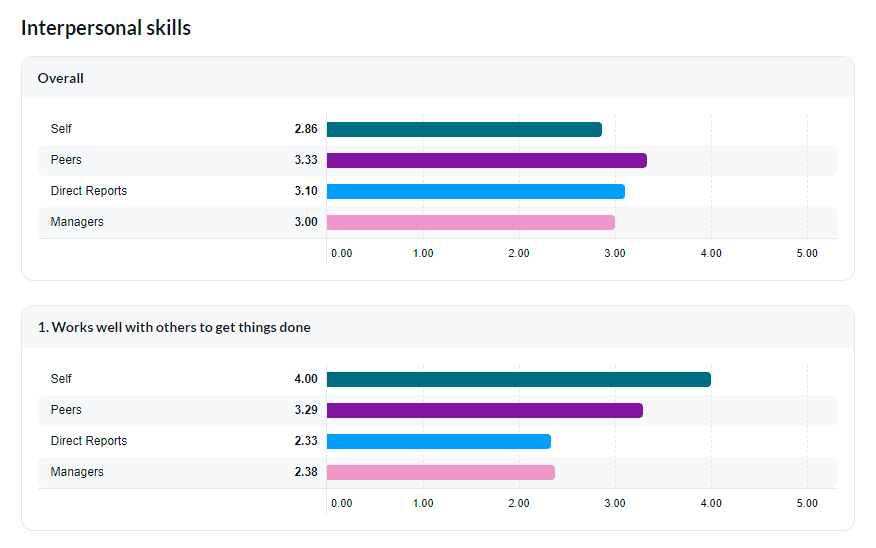
In a score block, an Average of Rater Groups will enable report readers to quickly compare the results across questions, as all selected raters results have been condensed into one. Ultimately, other group elements can be selected too to compare them with each other.
Chart mode
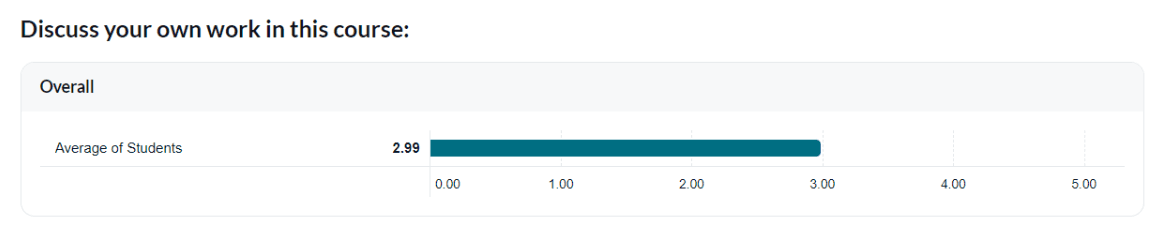
Table mode
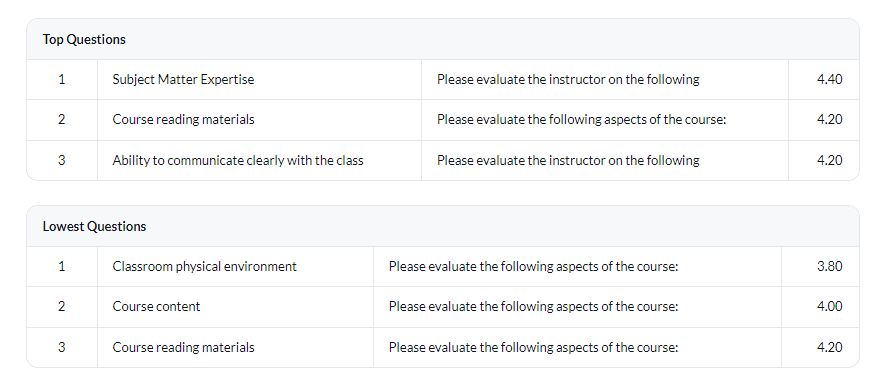
Cross Category - Category/question ranking
The Average of Raters Group element can be used to compare categories or individual questions.
Table mode
Cross Category - Category/question grouping - Score Average (Mean)
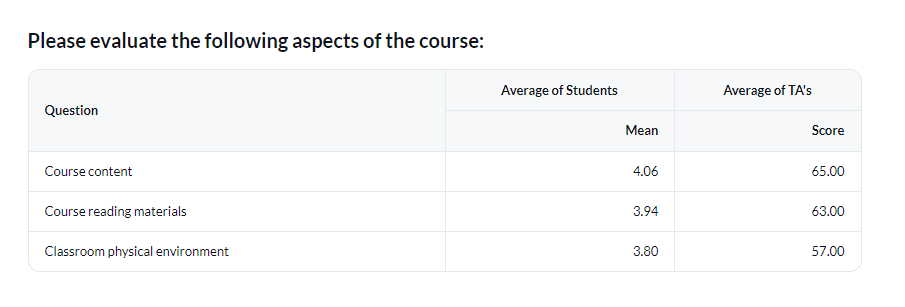
The Average of Raters Group element generally compares two different statistics relevant to each question/category. These statistics can be several types of group elements including the Average of Rater Groups.
Table mode
Cross Category - Category/question grouping - SUM Total Score & Sum Average Score
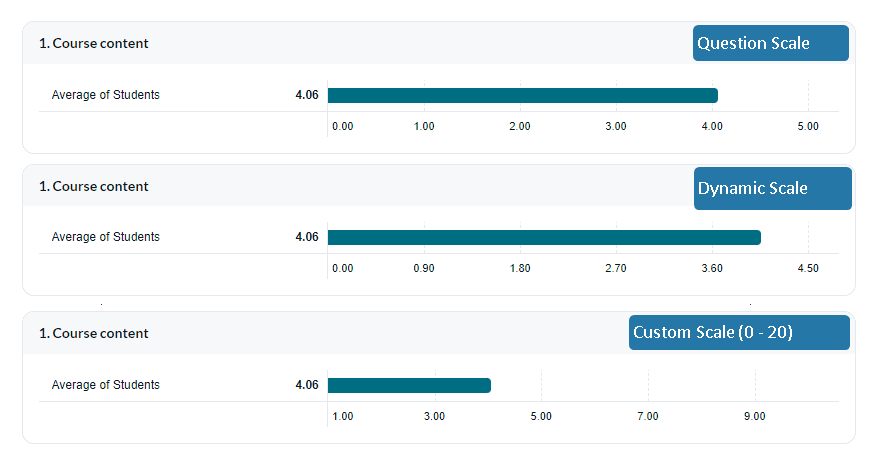
To accurately display graphical information of Average of Rater Group Elements with a Sum Total score or a Sum Average score for Question and Category Grouping blocks, it is recommended to change the Scale Options. Instead of using the default Question Scale range, it is best to use either the Dynamic Scale or a Custom Scale to represent the data because the sum values are likely to be larger than the question scale values.
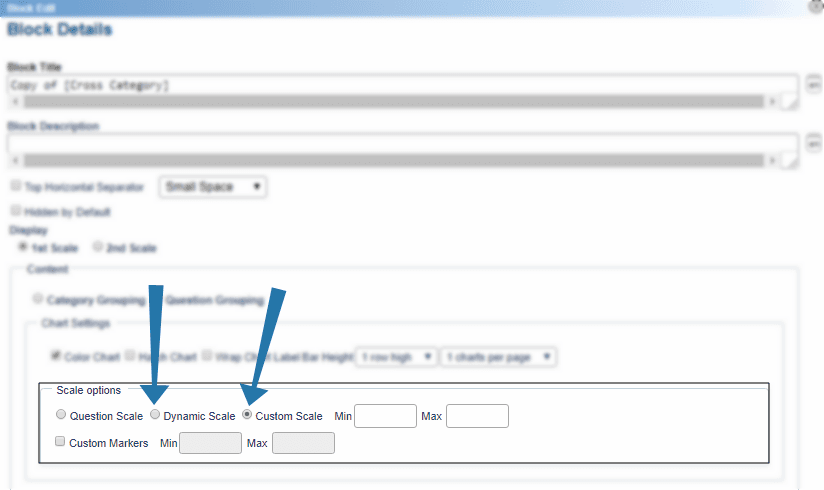
Below are examples of how graphs can look like with different Scale Options applied.
Cross Category - gap analysis
This type of block generally compares two different statistics relevant to each question/category and reports on the gap (difference) between both. These statistics can be several types of group elements including the Average of Rater Groups. This type of block can be used to determine the gap between different rater groups, or between an individual course and the entire department or faculty.
Table mode
Cross Category - summary
For this type of block, the Average of Raters Group Element is mandatory in order to enable a simple listing of all questions with their average scores. This block can be represented in a multitude of charts.
Some use case examples
- For a 360 Evaluation in a hospital or medical center, report readers might be interested in seeing data originating from non-medical staff and medical staff separately. This type of group element enables the creation of an average for non-medical staff, where the non-medical group is averaged out. Similarly, another average for medical staff could exist for more accurate comparison purposes.
- To generate an average score for which each respondent’s score is of equal weight regardless of which rating group they belong to, create a virtual group encompassing the desired rater groups (see Virtual Groups). This applies to a specific subject.
InGroup elements in reports
InGroup elements in reports
InGroup elements in reports