Student experience intelligence (SEI)
SEI introduction
Analyzing students’ comments using SEI can help your organization:
- enhance student learning,
- improve the educational experience,
- increase your organization’s agility.
This analysis provides insights which can support action plans to ensure that students are getting the most from their courses and programs and are feeling engaged in the learning experience. These insights can also facilitate your organization’s effort to reduce the risk of student and faculty attrition.
Suggested feedback sources
- End-of-term course evaluations
- Midterm course evaluations
- Online learning experience surveys
- Undergraduate admissions surveys
- Graduation surveys
- Student wellness surveys
- Student satisfaction inventory (SSI) surveys
- RNL Satisfaction-Priorities (SPS) surveys
- National Survey of Student Engagement (NSSE) surveys
- Canadian University Survey Consortium surveys (CUSC)
- Canadian Graduate and professional student Survey (CGPSS)
- another bullet point
SEI analysis
The SEI enables you to categorize comments based on over a thousand pertinent Teaching and Learning (T&L) and student experience topics together with the 3 default analysis types- Sentiments (to measure sentiment level), Recommendations (to discover actionable insights) and Alerts (to detect and flag harmful text for further consideration). Results of the analysis are presented in 6 screens: Summary, Overview, Widgets, Topics explorer, Comments explorer and Redaction workspace (see screenshots below).
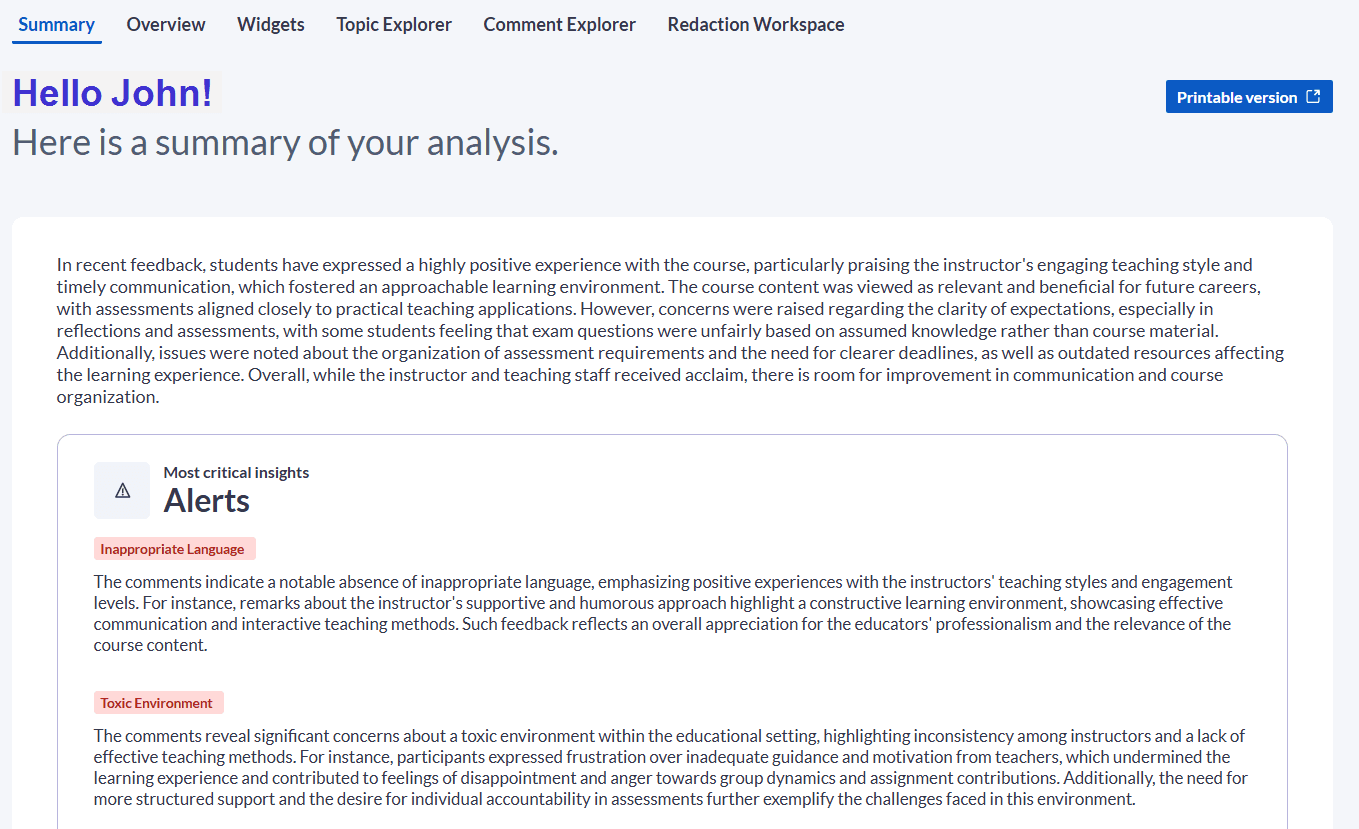
Summary
The summary page provides users with an quick snapshot of the analysis and highlights the most critical insights.
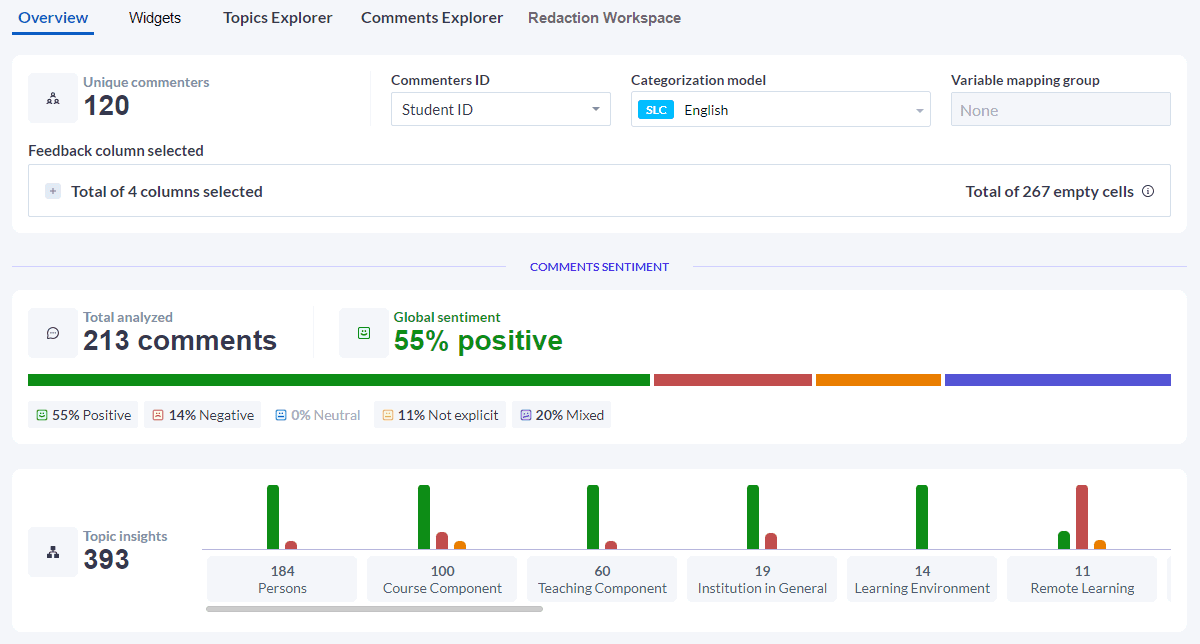
Overview
This screen enables you to quickly grasp which insights matter the most in your analysis using a combination of graphs, bars, pie charts and heat maps to highlight key insights sorted by sentiments, recommendations, topics and alerts.
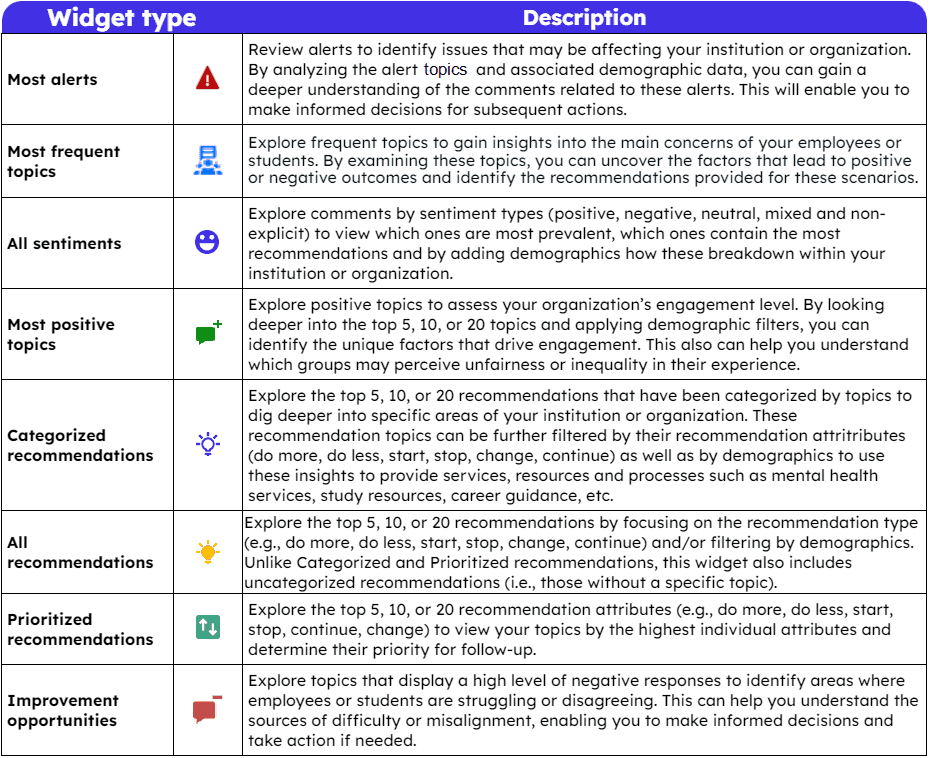
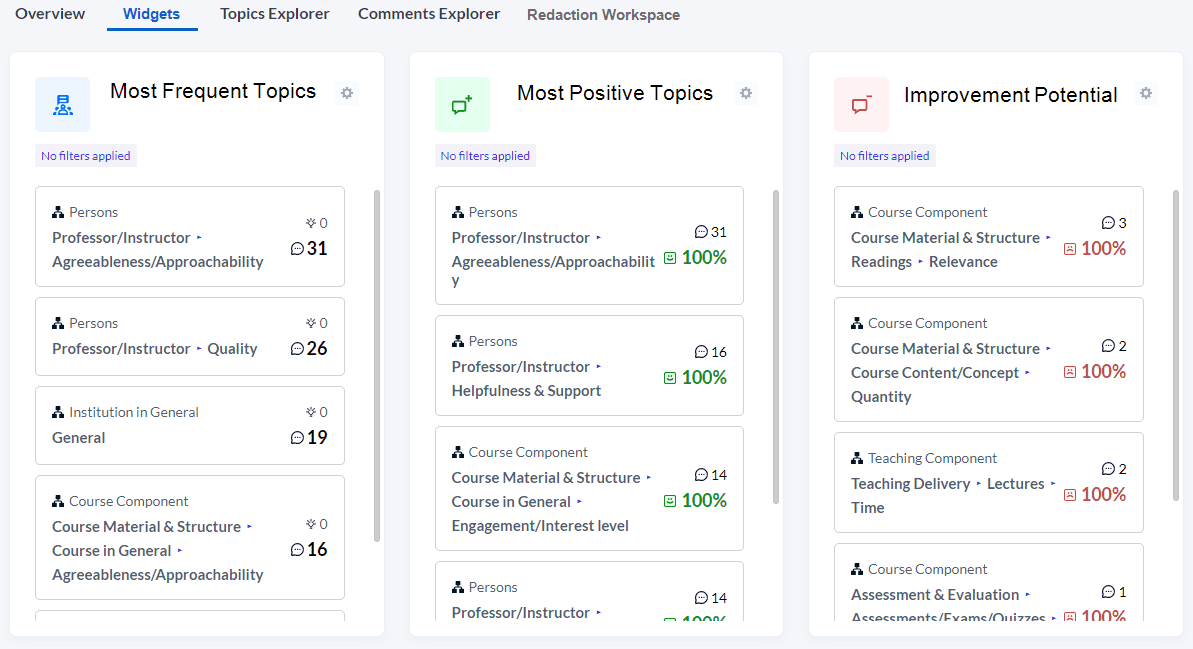
Widgets
Explore your analysis based on these specialized widgets:
You can also create new widgets or filter the existing widgets to view your results by any demographic or filter in the widget settings.
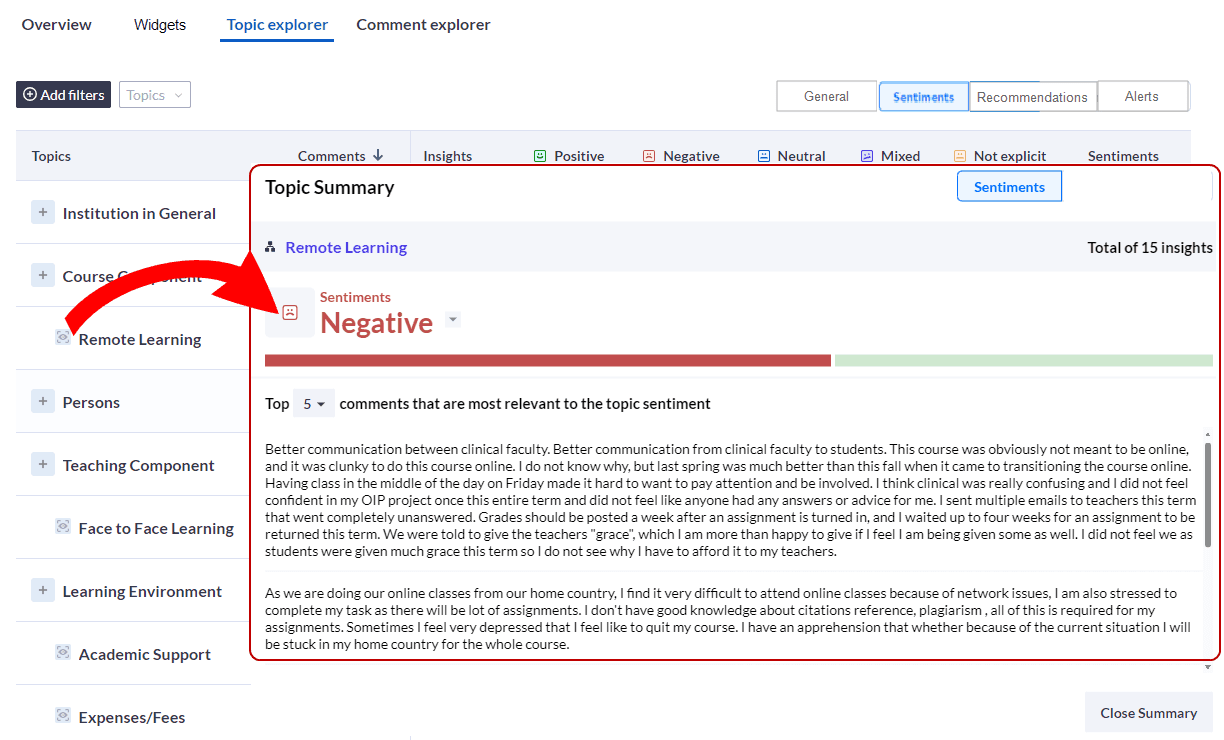
Topics explorer
To assist users in focusing in on the comments that most reflect the sentiments or recommendations selected by MLY, the Topic Summary displays the top 5, 10, or 20 comments that scored highest for that topic.
This screen displays high-level information on the themes discovered during the analysis, sorted by Feelings or Recommendations. Users can click on the icon next to the different themes to expand the section and drill down to display sub-themes that provide more specific information. In addition, users can click on the icon to display the most representative comments for the selected sub-theme. Click here to find out more about Sentiments and Recommendations.
Theme structure
Click here to see the topic structure with definitions, keywords and examples.
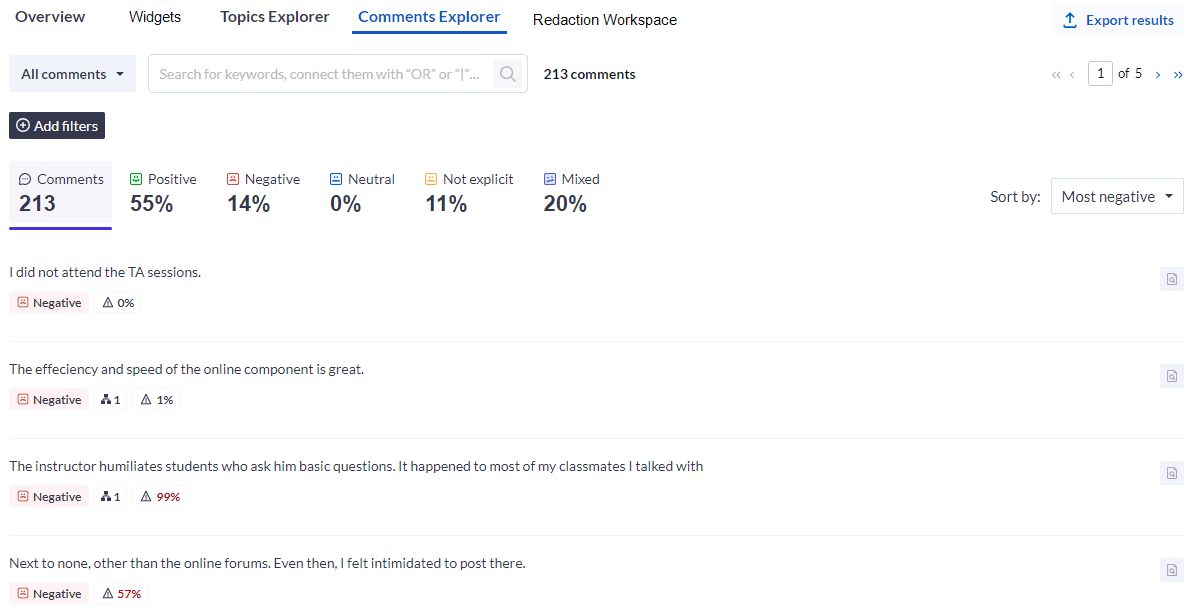
Comment Explorer
This screen lists all analyzed comments and provides the total number of comments analyzed as well as the overall sentiment percentage for each sentiment attribute (positive, negative, neutral, not explicit and mixed). You can also sort the comments listed according to the following criteria: most positive, most negative, most recommended, Alerts: Low to High, and Alerts: High to Low. Just below each comment, the general sentiment, number of topics, number of recommendations and alert level are displayed.
Further analysis
Use this link to access step-by-step instructions for Filter your analysis.
InEmployee experience intelligence (EEI)
InMLY insights
InMLY insights