Example tabular report content in course evaluations
Reporting on the feedback is essential for key stakeholders in your organization to identify actionable items and make high-level decisions. Visualizations can draw attention to important areas in the data and lead you to insights. In this document, we will walk you through a variety of options for visualizing data in reports as well as the steps and requirements needed.
Before consulting this document, it is assumed that you are familiar with setting up a standard report. To learn more, see Create a new report.
About this document
- Only contains report content with tabular visualizations.
- Primarily used in reports for course evaluations.
- Examples in this document are used mainly in individual and group by reports.
- To view report content with chart visualizations, please refer to Example chart report content in course evaluations.
Common terms in reporting for course evaluations
Common terms that are used when creating reports for course evaluations:
Datasource
Also known as a table or “view”, a datasource is a dataset that is applied towards a survey campaign. It can contain the survey respondent information, including students’ or instructors’ names, email addresses and other demographic data that will be useful in the analysis (user datasource). A separate datasource can contain items to be evaluated, such as a list of courses in course/subject evaluations (object datasource).
Course evaluation
The typical course evaluation refers broadly to the student end of class summative survey in a college/university. Other common terms used for course evaluation include "student evaluation", "learning feedback", "student feedback", "paper evaluation", "module evaluation", and "teaching effectiveness".
Report block
A report block is the container of data that generates specific types of content (tables and/or charts) in reports. For example, the Question report block presents response data for a specific question or set of questions while the Frequency report block displays the number of times a particular answer was selected.
Rollover report
A rollover report provides an overall aggregate calculation of all results collected for all subjects or secondary subjects in a project. They are useful if you want to get an overall aggregated view of survey results.
Group by report
Similar to a rollover report except that data will be aggregated according to various predefined groups within an organization (courses, instructors, department, etc.).
Individual report
Tailored for evaluating an individual person or thing, each stakeholder within an institution can receive their own custom report containing only response data relative to them (instructors).
Group elements
Group elements help to contextualize the results in a report and provide different methods of data calculations for each group in a project. They offer more granularity and greater flexibility in terms of displaying the data and, ultimately, help the report viewer to make sense of the data in a report. Some examples include the average of rater group element which will give the average for student responses, and the breakdown by rater group element which enables the user to see the results broken down by students.
Norms/benchmarks
Norms or benchmarks are used as a reference. They are often based on aggregate data analysis, such as overall instructor, department, school or university results, against which scores can be compared.
Academic period
An academic period is the specific duration of time in which a course and/or instructor is evaluated. Some common academic periods are measured in reporting either by year or semester.
Question category
A question category is a grouping of questions that share a common theme whether it be related to courses, instructors, or specific skills. An example of a question category would be the single selection table question "The instructor for this course..." which is followed by a series of statements that reflect on several different aspects of the question category itself, in this case being the instructor for the course.
Response analysis
Analyze the response rate of your course evaluations.
Response rate table
Display the response rate for the student rater group.
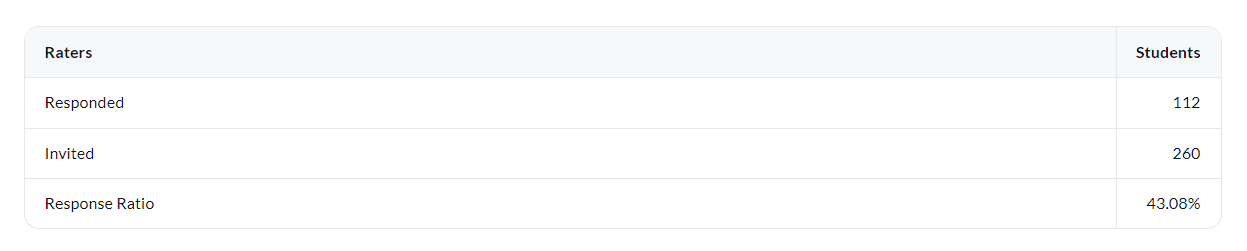
In public surveys, only the responded count will be displayed. The invited count and response ratio will not be available.
Response rate ratio - report cover page
Display the response rate for the student rater group on the report cover page.
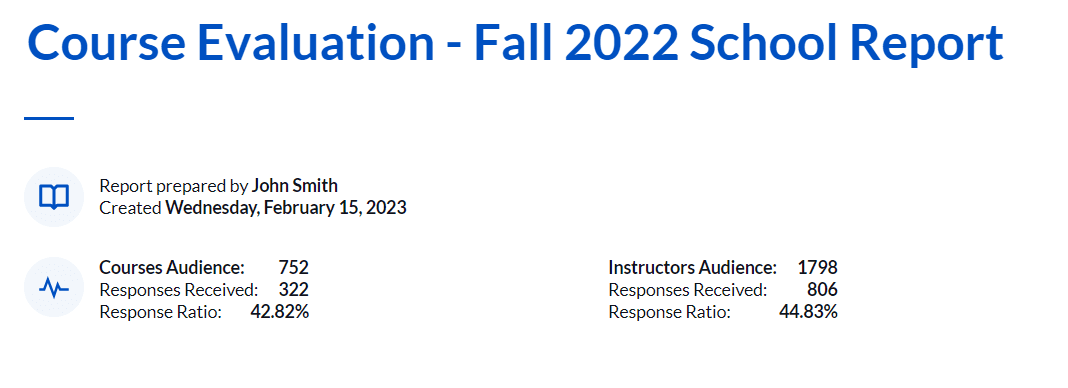
In public surveys, only the responded count will be displayed. The invited count and response ratio will not be available.
Quantitative analysis
Analyze the response data using statistical calculations.
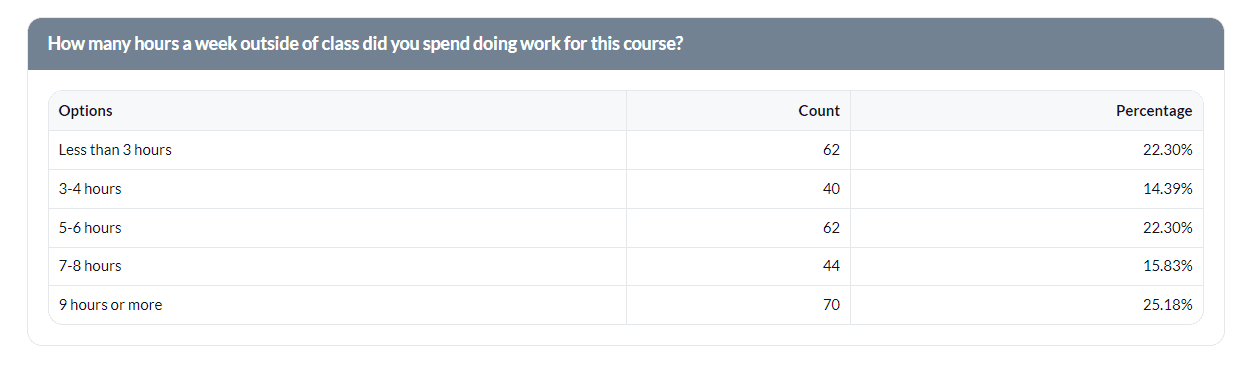
Response frequency table for a single question
Display the number of times a particular answer was selected for a single question.
Response frequency table for multiple Likert questions
Display the number of times a particular answer was selected for multiple Likert scale questions.
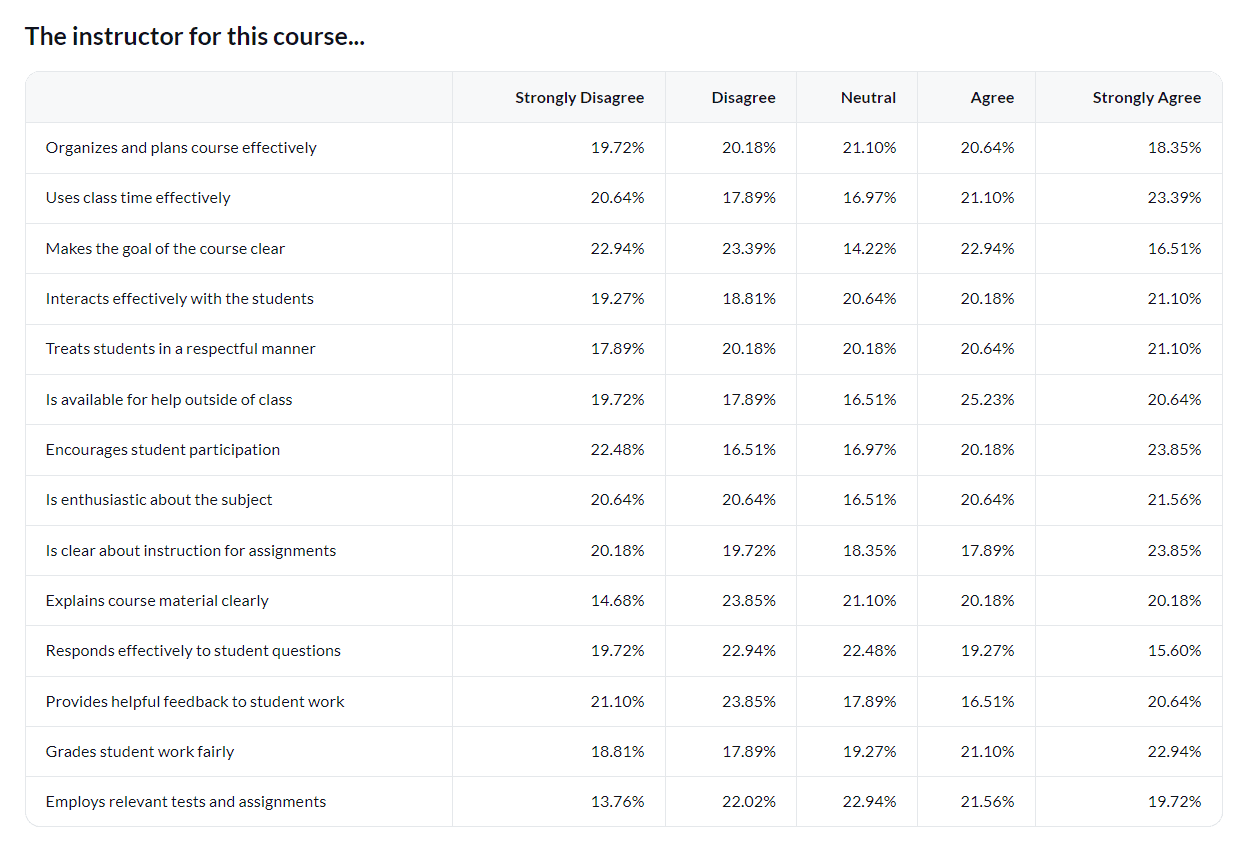
- Supported only in subject-based projects.
- Not supported in rollover reports.
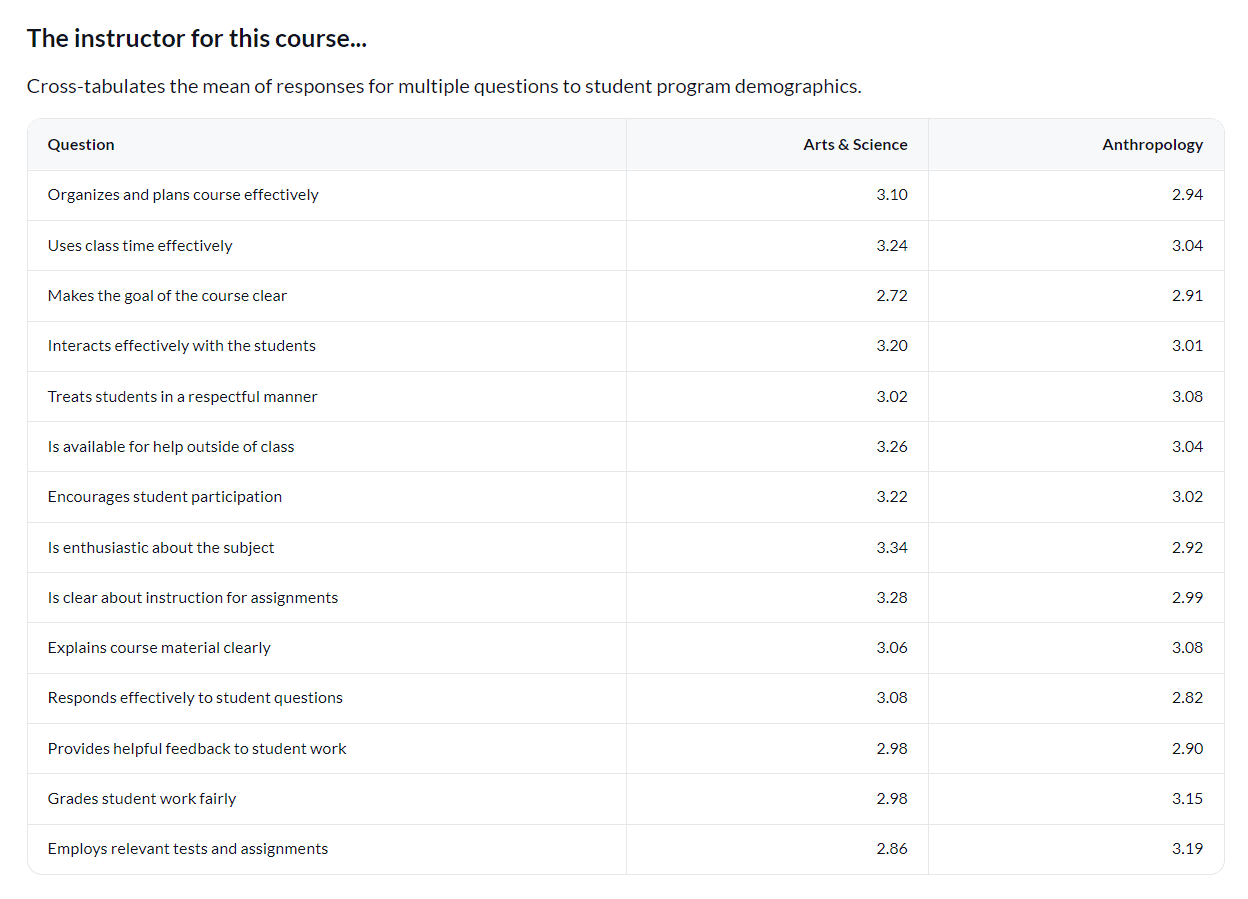
Question mean table for multiple questions
Display the department, school, and university mean of student responses for multiple Likert scale questions.
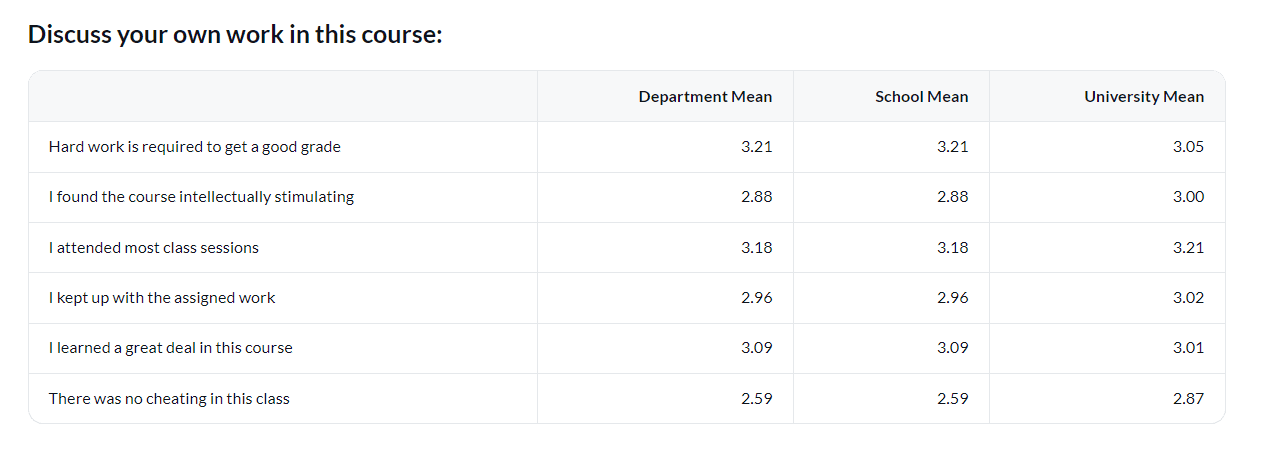
- Supported only in subject-based projects.
- Not supported in rollover reports.
Multiple stats table for a question category (version 1)
Display the number of times a particular answer was selected for a single question category along with multiple stats (mean, median, standard deviation).
A question category is a grouping of questions that share a common theme whether it be related to courses, instructors, or specific skills. An example of a question category would be the single selection table question "The instructor for this course..." which is followed by a series of statements that reflect on several aspects of the question category itself, in this case being the instructor for the course.
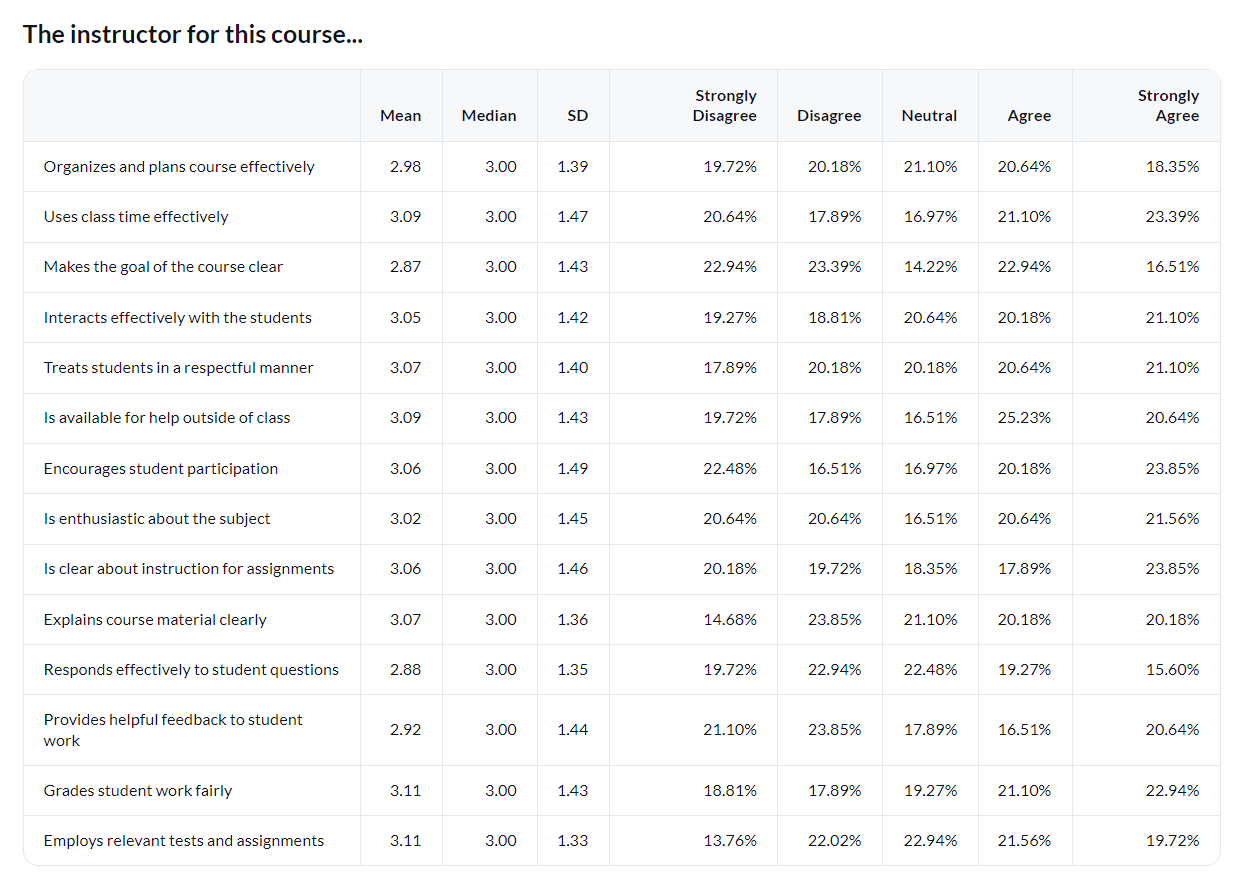
- Supported only in subject-based projects.
- Not supported in rollover reports.
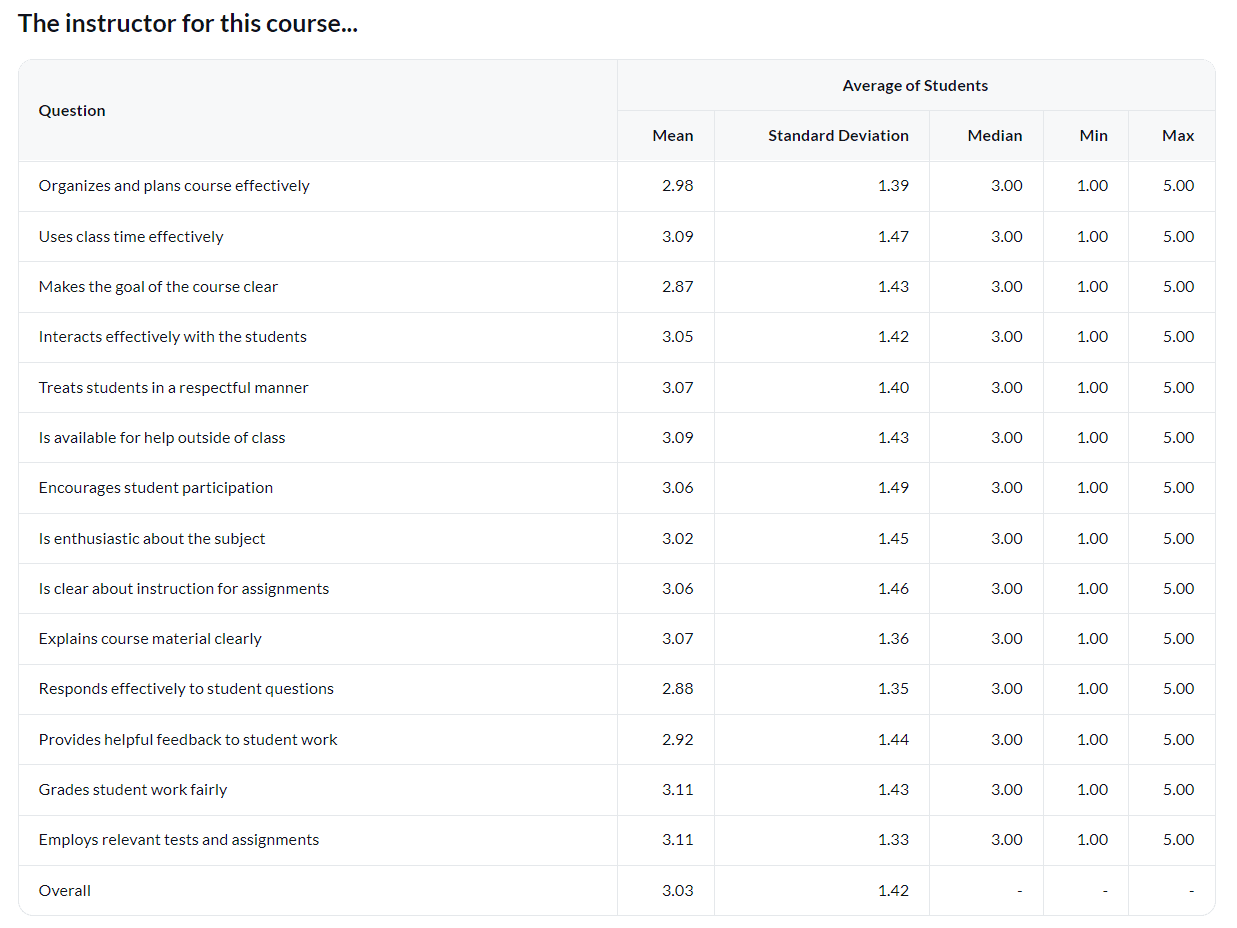
Multiple stats table for a question category (version 2)
Display multiple statistics (mean, standard deviation, minimum value, maximum value) for each rating item in a question.
Multiple stats table for a question category (version 3)
Display the number of times a particular answer was selected for multiple Likert scale questions along with multiple benchmark statistics on a course and department level.
Norms or benchmarks are used as a reference. They are often based on aggregate data analysis, such as overall instructor, department, school or university results, against which scores can be compared.
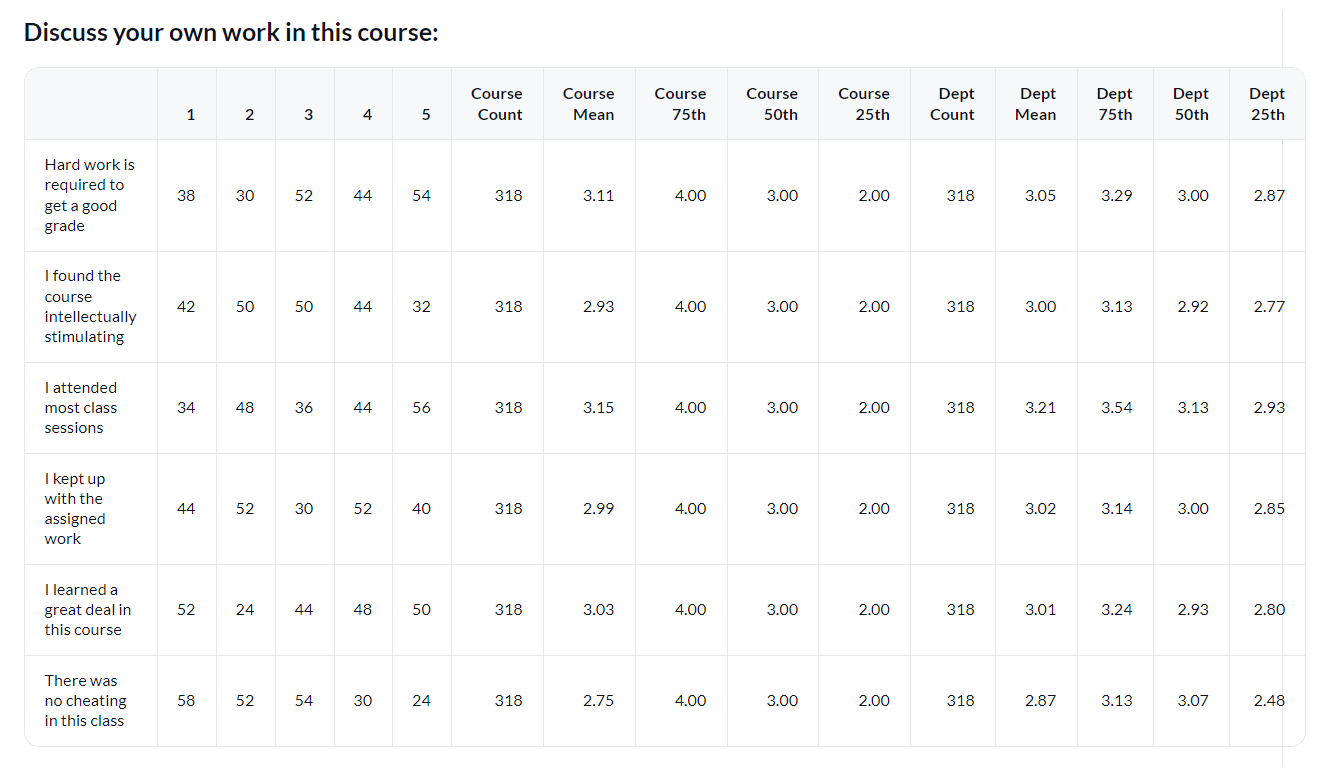
- Supported only in subject-based projects.
- Not supported in rollover reports.
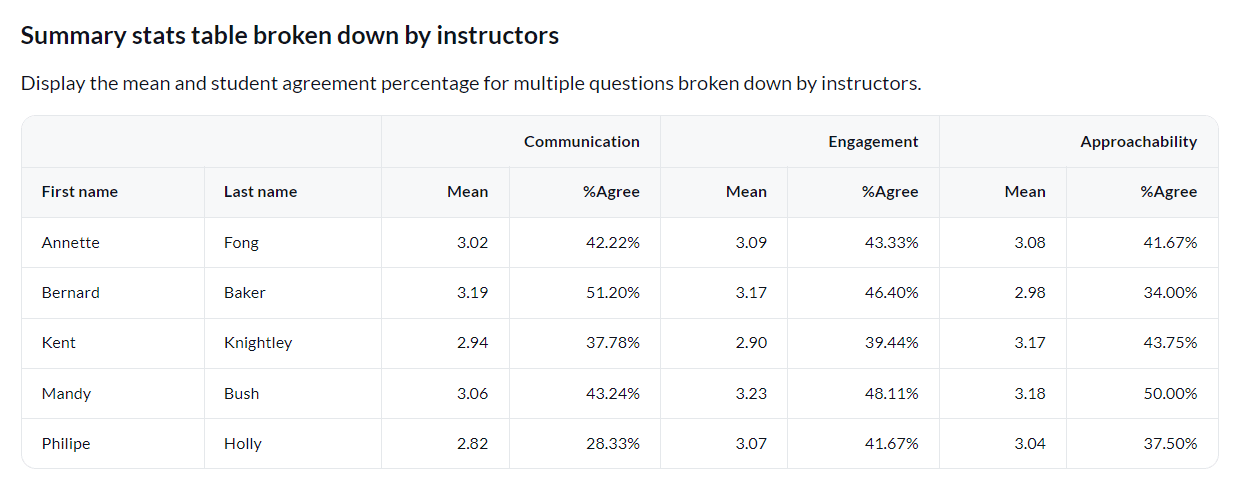
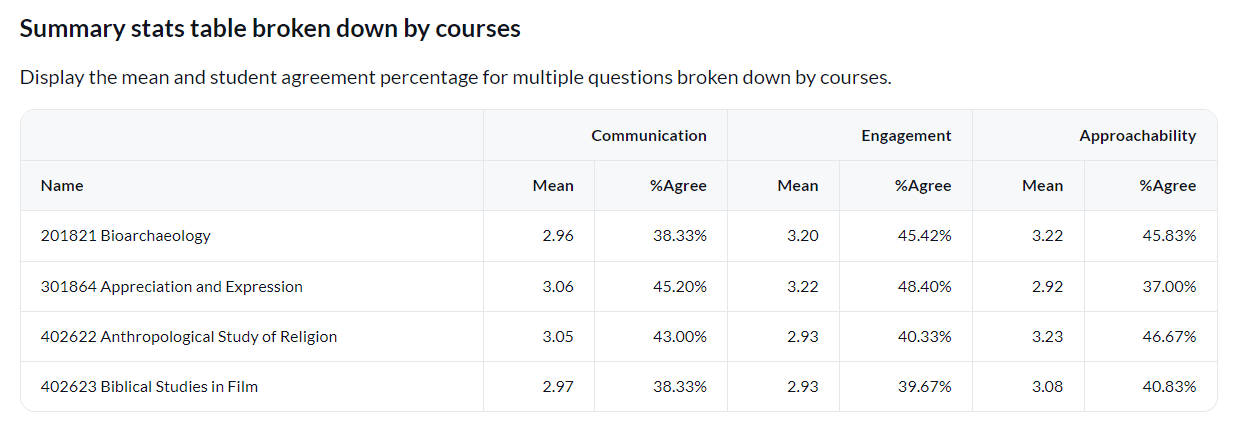
Summary stats table broken down by subjects
Display the number of times a particular answer was selected for multiple Likert scale questions broken down by instructors or courses.
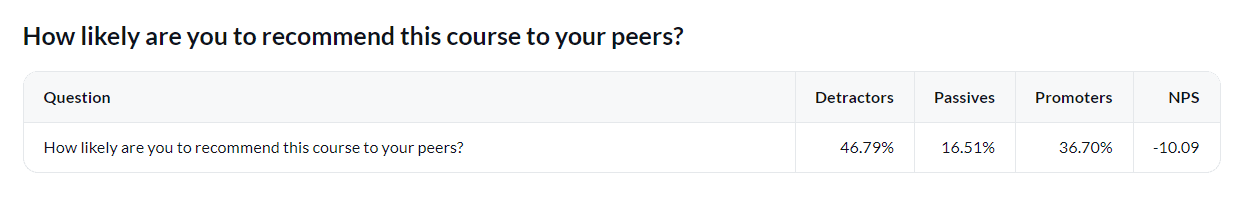
Net promoter score table
Display the Net Promoter Score (NPS) which is a calculated value between the promoters (percent positive rating) and the detractors (percent negative rating) for a question.
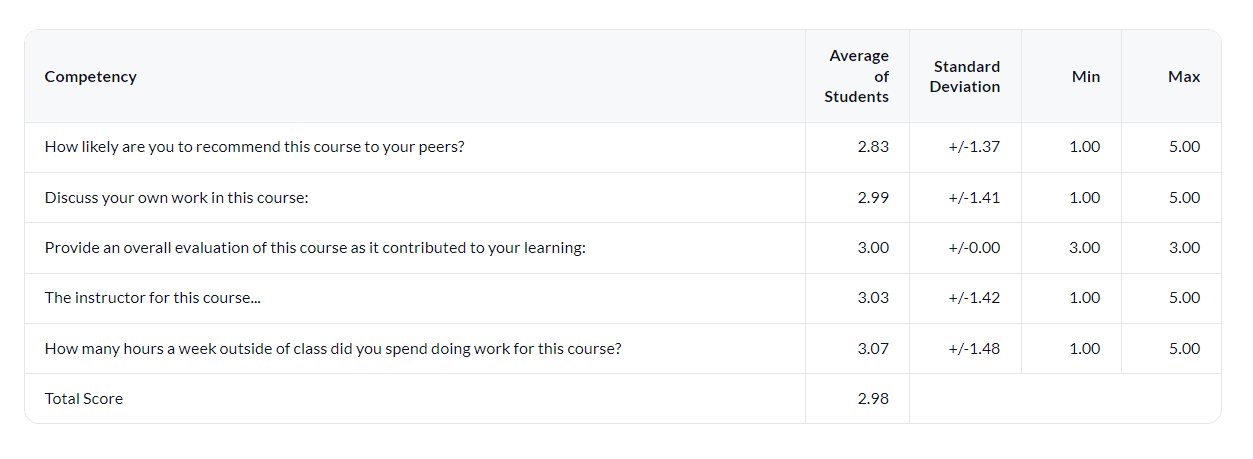
Summary stats table per question category
Display multiple statistics (mean, standard deviation, minimum value, maximum value) for each rating item per question category.
Qualitative analysis
Analyze the response data using subjective judgment.
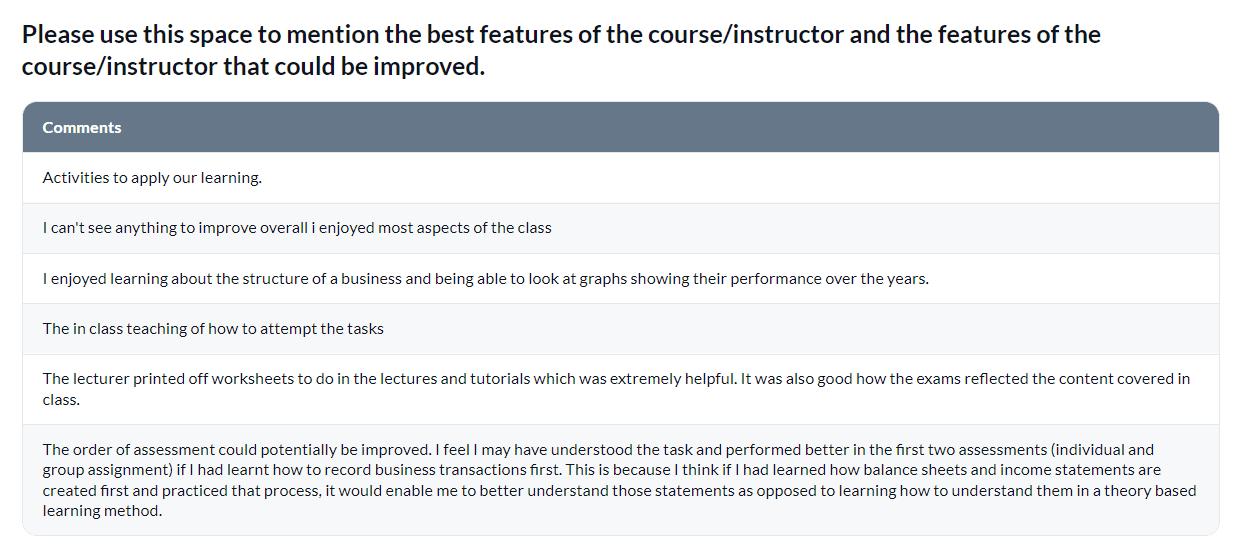
Comment response table
Displays the full text of all student responses received for a selected comment question.
Text analytics table
Display the most commonly mentioned themes for the entire university. These themes and rates of occurrence can serve as a baseline to compare with other departments and individual courses.
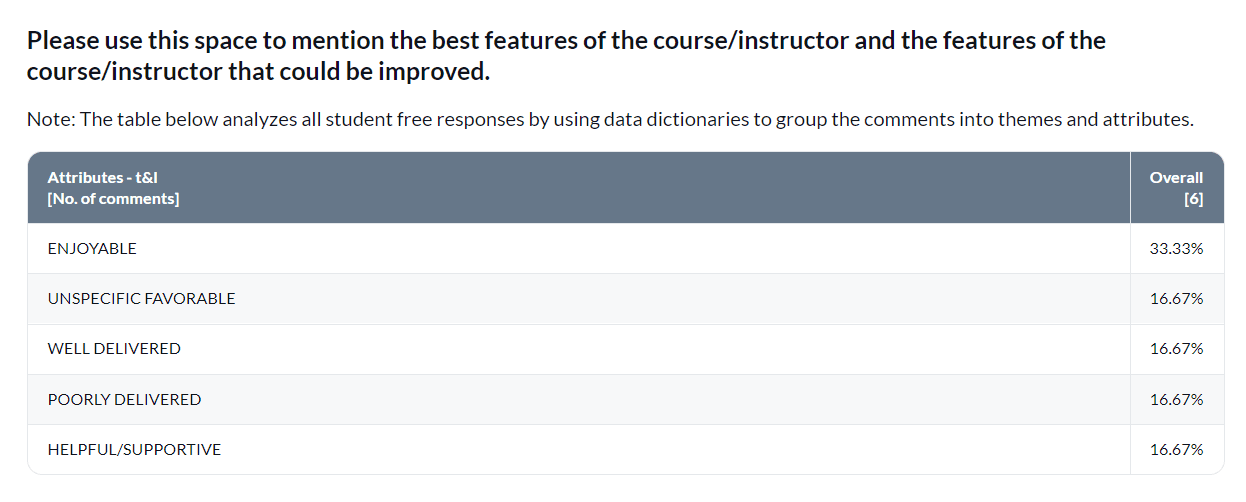
To create text analytics tables, a BTA T&L dictionary must be applied beforehand.
Demographics
Analyze and breakdown particular demographics of the student rater group.
Demographics analysis table
Display demographic information related to students and their responses such as per department, GPA range, and residency status.
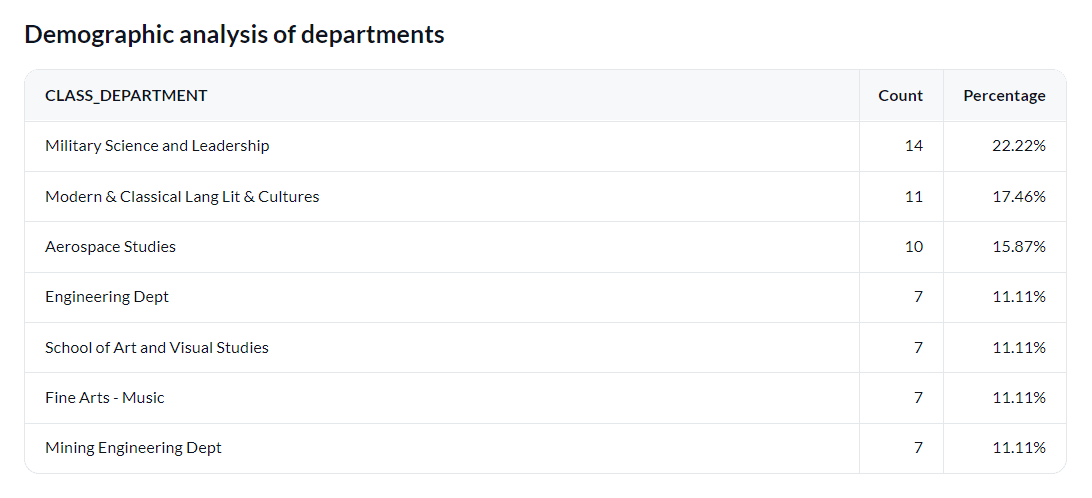
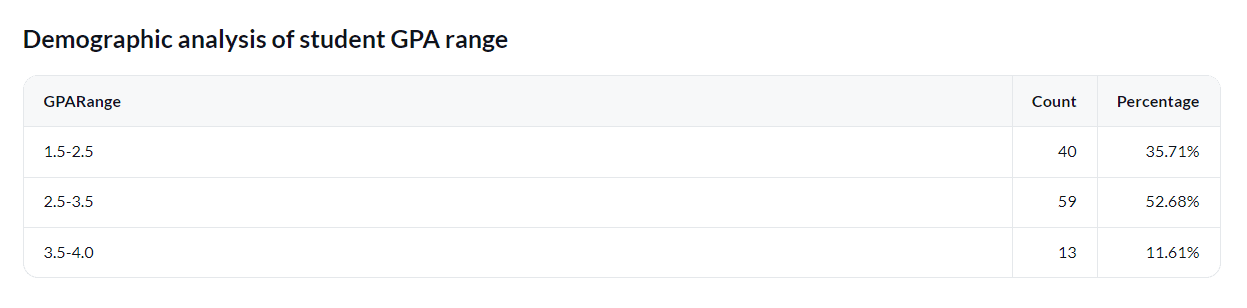
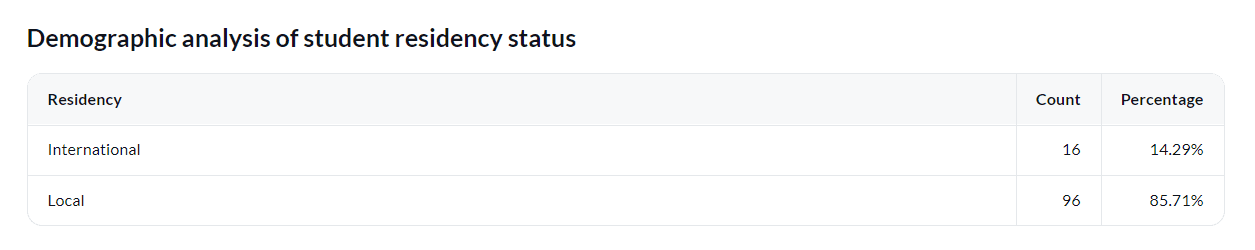
- In the user datasource, there must be a field to represent the type of demographics data you wish to display.
- The demographics analysis tables demonstrated were created in a rollover report.
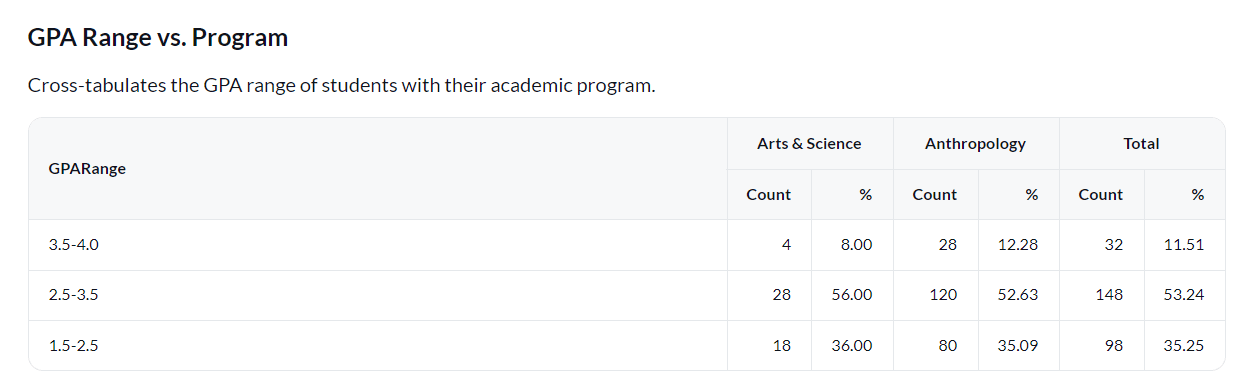
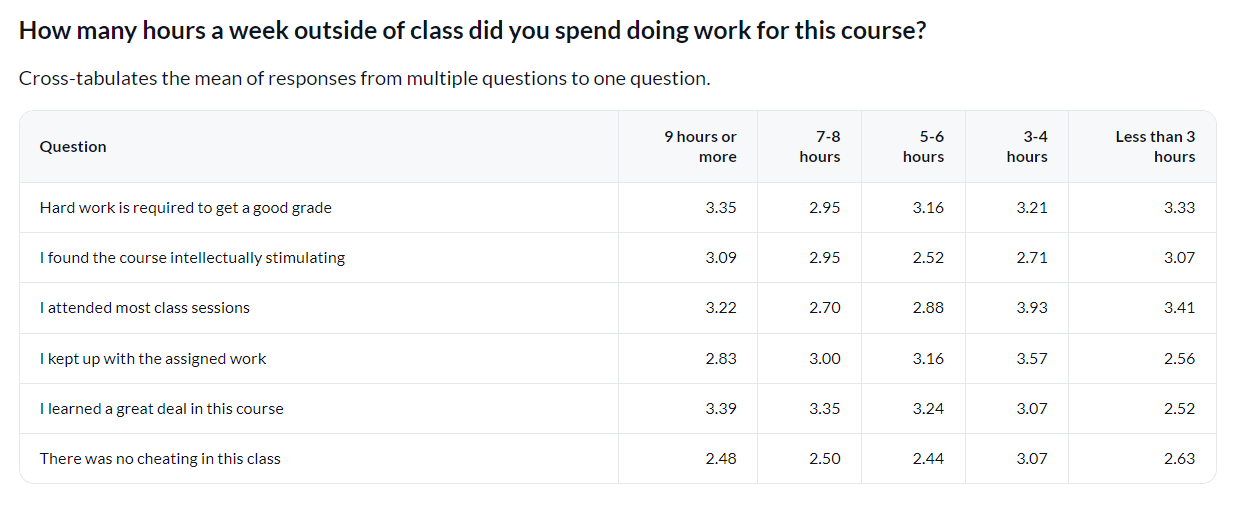
Cross-tabulation
Analyze the relationship between student rater demographics and multiple Likert questions.
In the user datasource, there must be a field to represent the type of demographics data you wish to display.
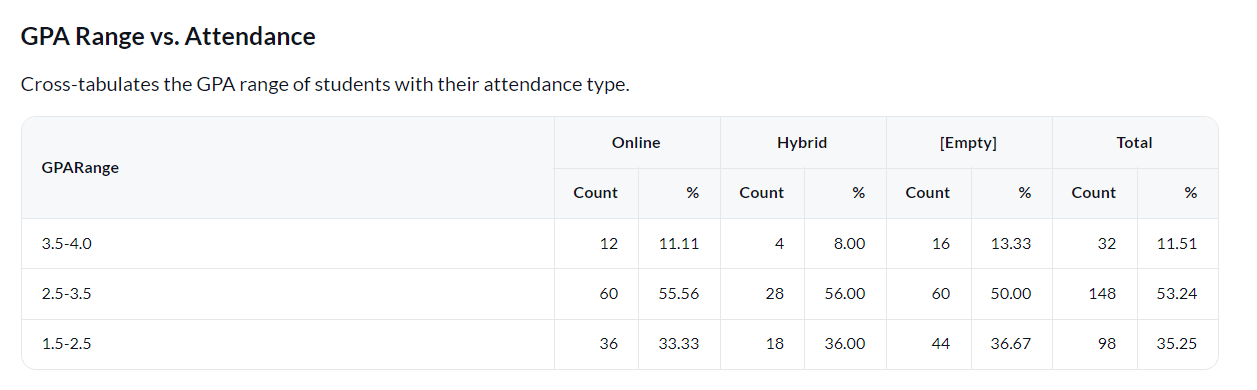
Demographic vs. demographic table
Display a table that has cross-tabulated data between different student rater demographics.
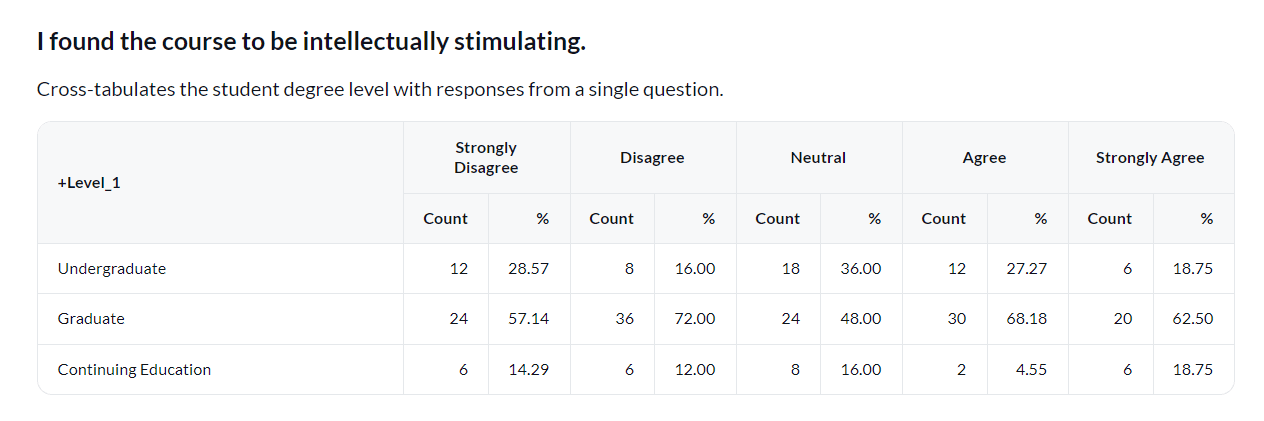
Demographic vs. question statistic table
Display a table that has cross-tabulated data between a student rater demographic and question statistic.
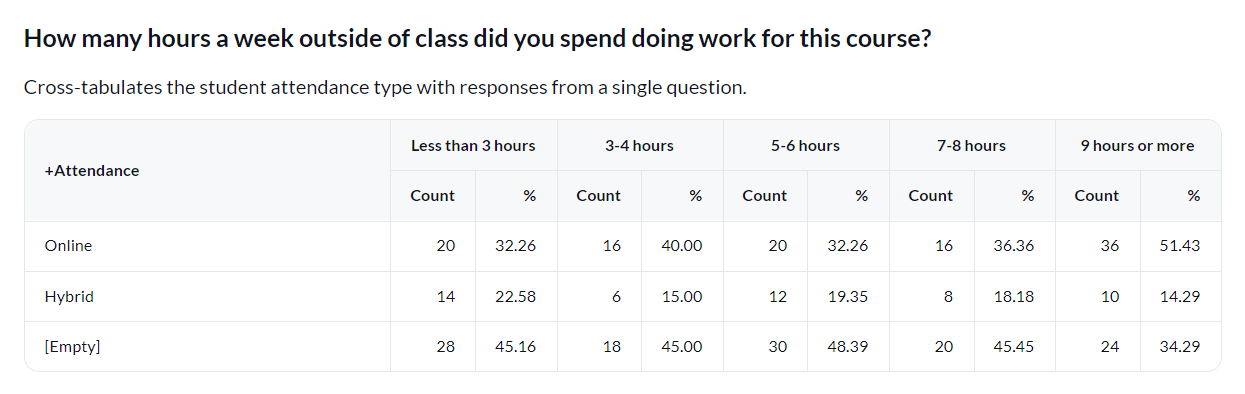
Question statistic vs. demographic table
Display a table that has cross-tabulated data between a question statistic and a student rater demographic.
Question statistic vs. question statistic
Display a table that has cross-tabulated data between two question statistics.
Trend analysis
In order to track and analyze trends between different academic periods (years or semesters) in your institution, you will need to map all projects from each academic period to a master project so that data can be analyzed and displayed together. This will provide you with unique insights to identify any trends in improvement.
- Project mapping can be applied to any type of report (individual, group by and rollover).
- Not all visualizations types (report blocks) support trend analysis. This section highlights the ones that do.
- Question bank question types are not supported for trend analysis in reports.
- For best insights, larger data sets are recommended. Aggregate data found in a report grouped by course, instructor or department, for example, can often help uncover trends.
- The Blue Dashboard is an alternative solution built from the ground up with trend analysis in mind. It supports filtering, breakdowns and thresholds for safe querying of each stakeholder's respective results. To learn more, see Blue Dashboard (Overview).
To view specific steps on how to map your projects, questions, and rater groups all in one report, see Map projects together for reporting.
Response rate table per academic period
Display and compare the response rate for the student rater group from different academic periods.
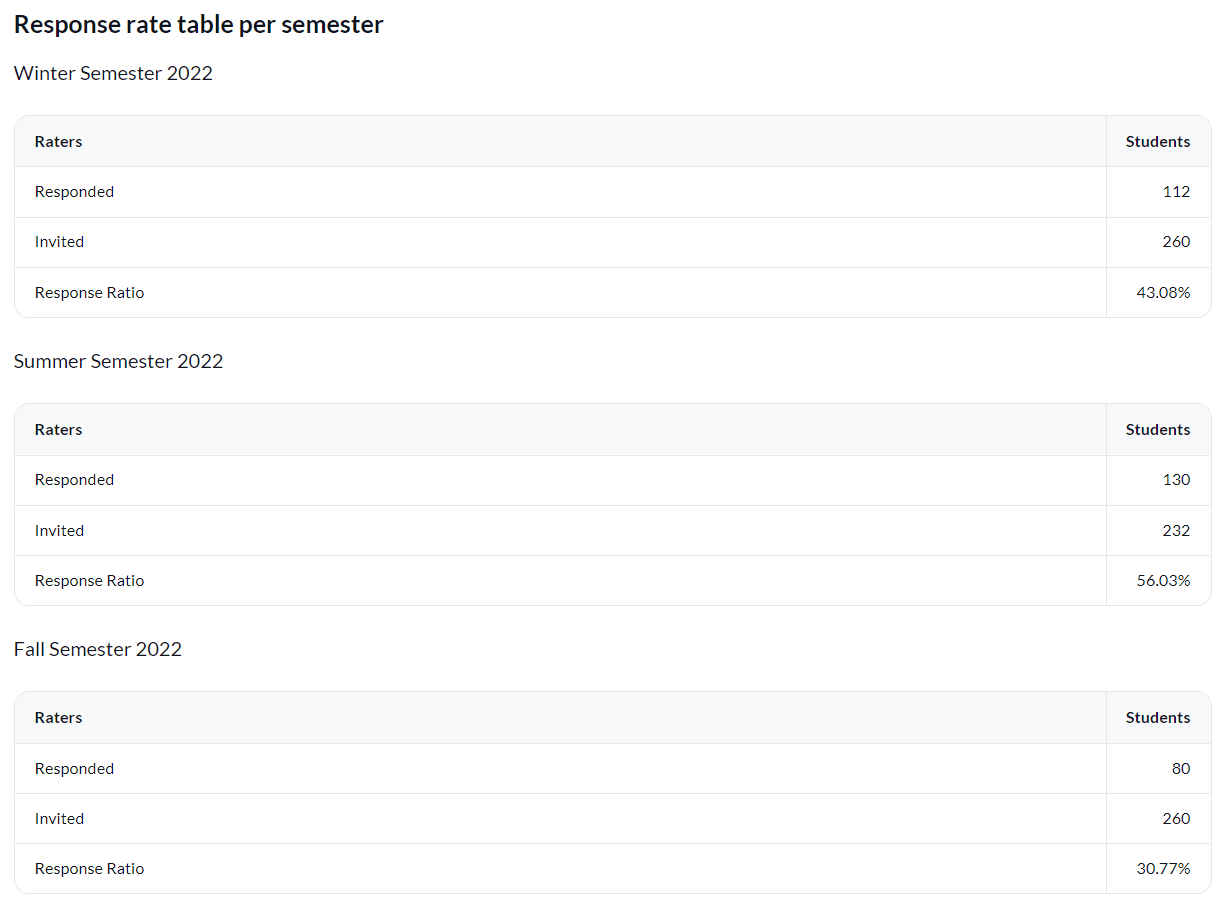
In public surveys, only the responded count will be displayed. The invited count and response ratio will not be available.
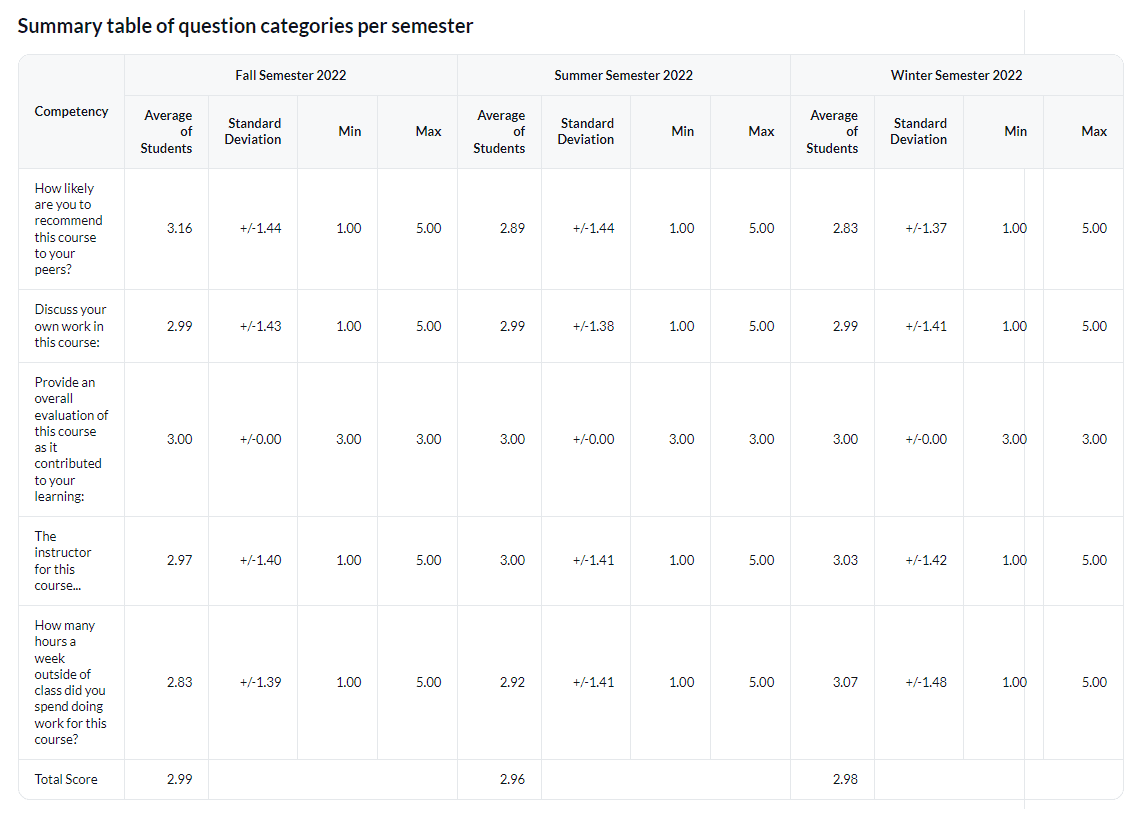
Summary table of question categories per academic period
Display and compare multiple statistics (mean, standard deviation, minimum value, maximum value) for each rating item per question category across different academic periods.
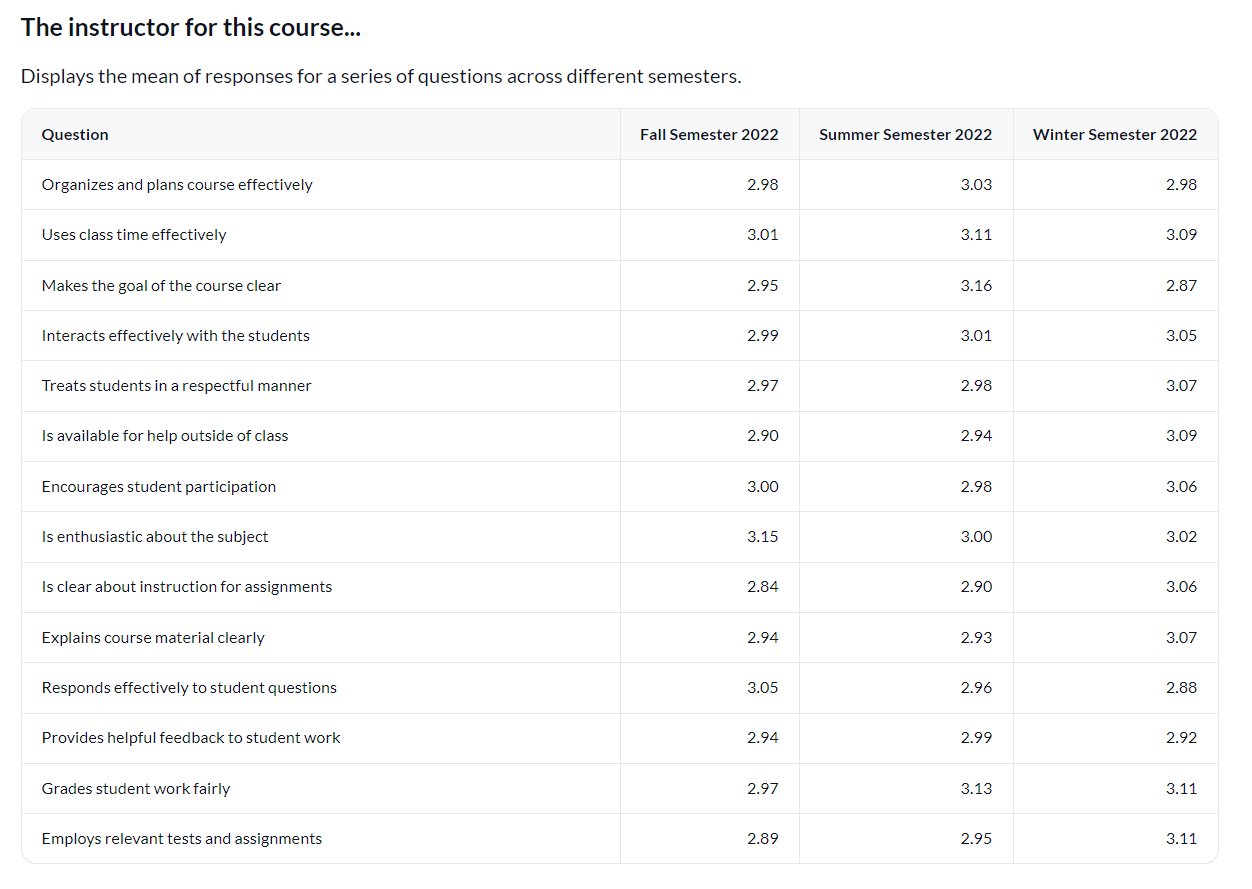
Question mean table of a single category per academic period
Display and compare the mean for each rating item in a question category across different academic periods.
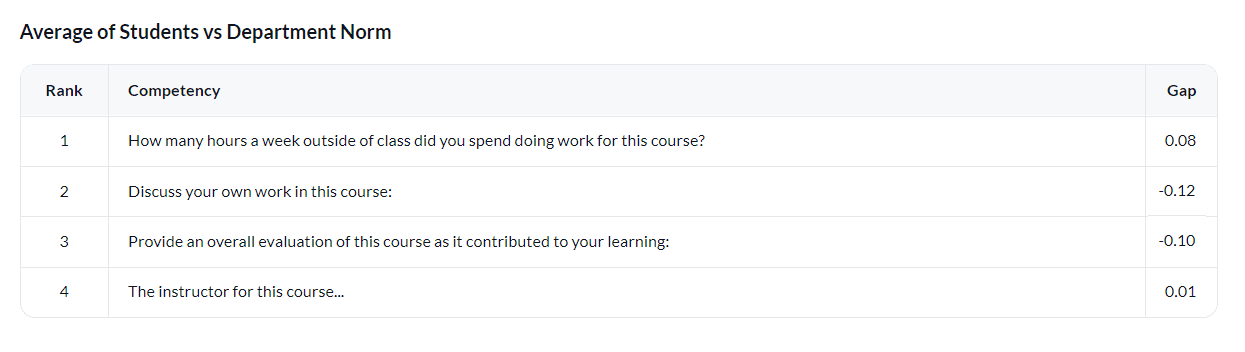
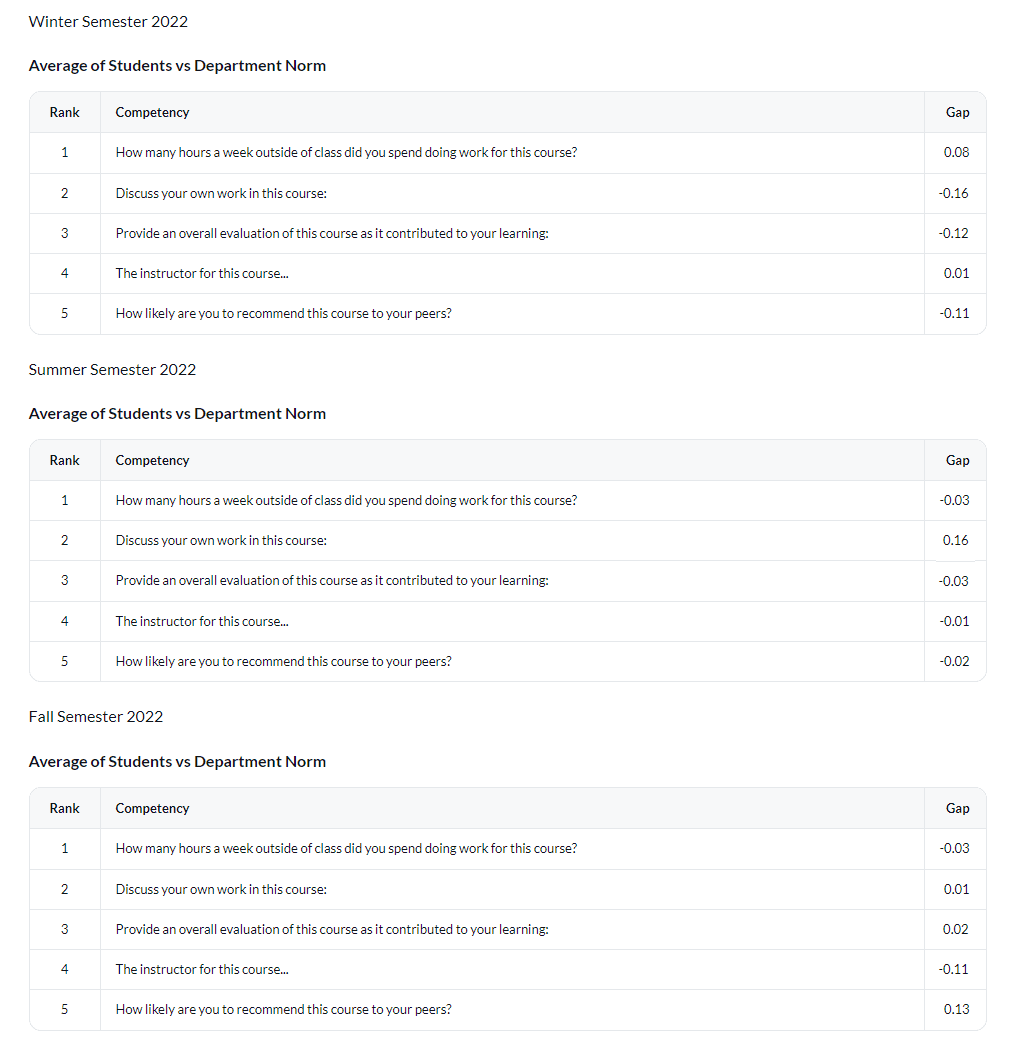
Gap analysis table per academic period
Compare the student mean score versus a benchmark per question category across different academic periods.
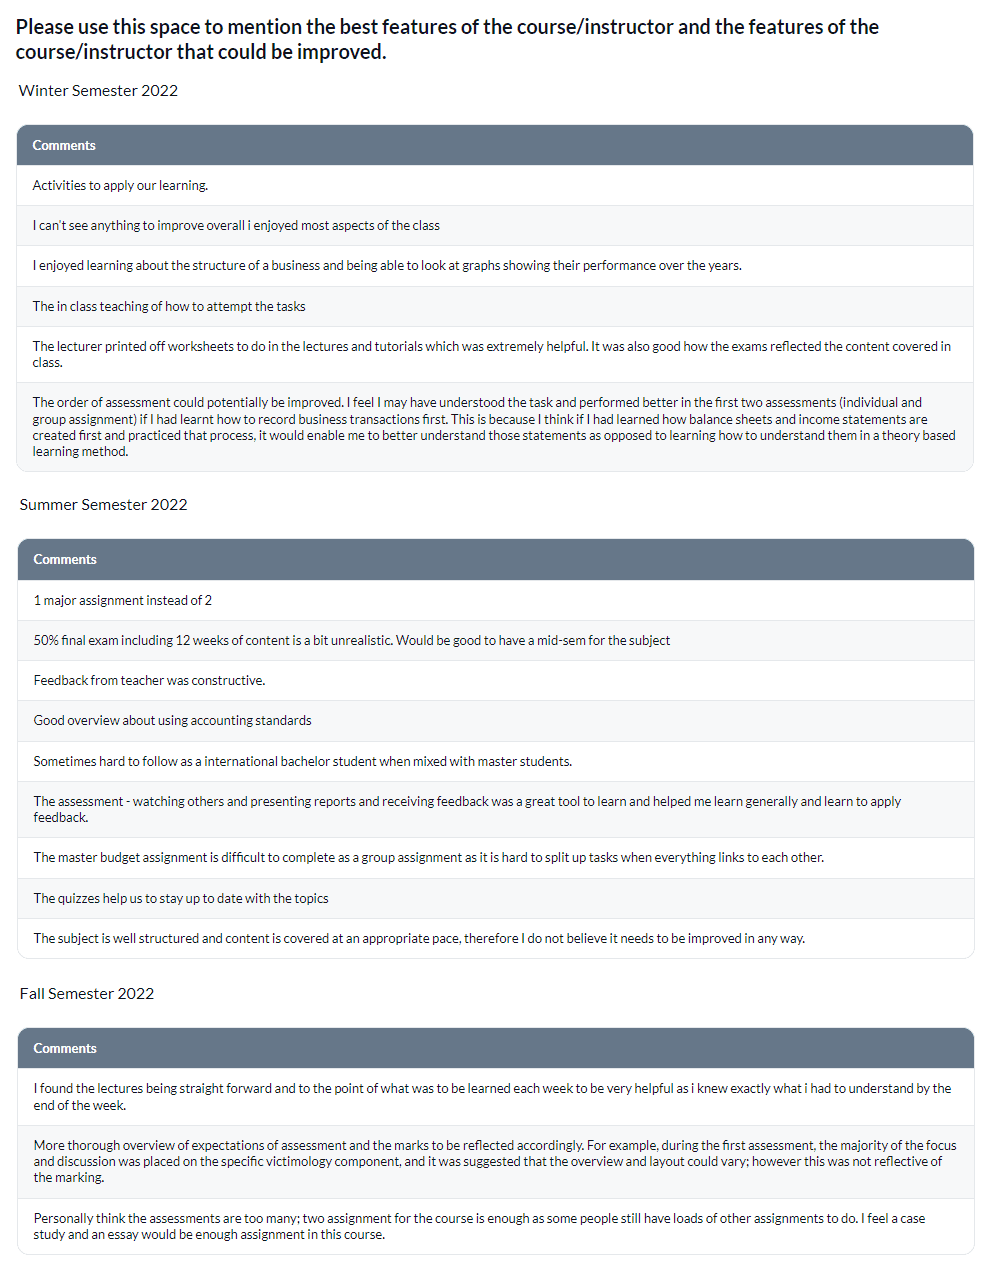
Comment response table per academic period
Displays the full text of all student responses received for a selected comment question across different semesters.
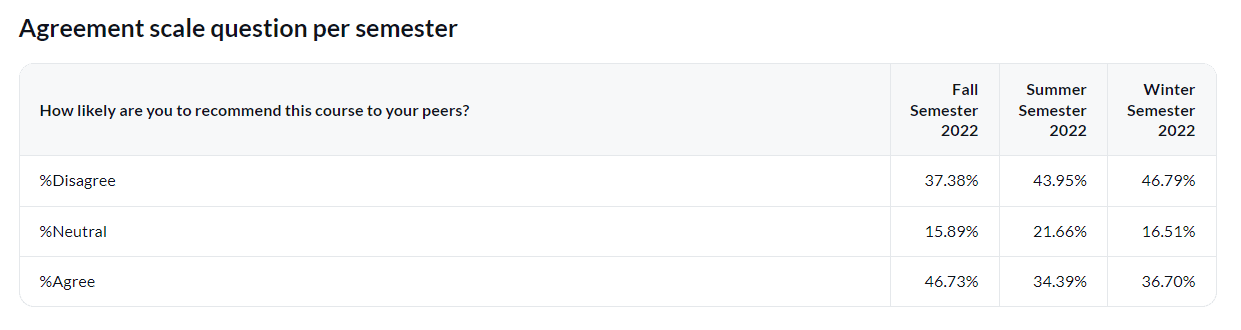
Agreement scale question per academic period
Display the agreement scale response in percent from a single question across different academic periods.